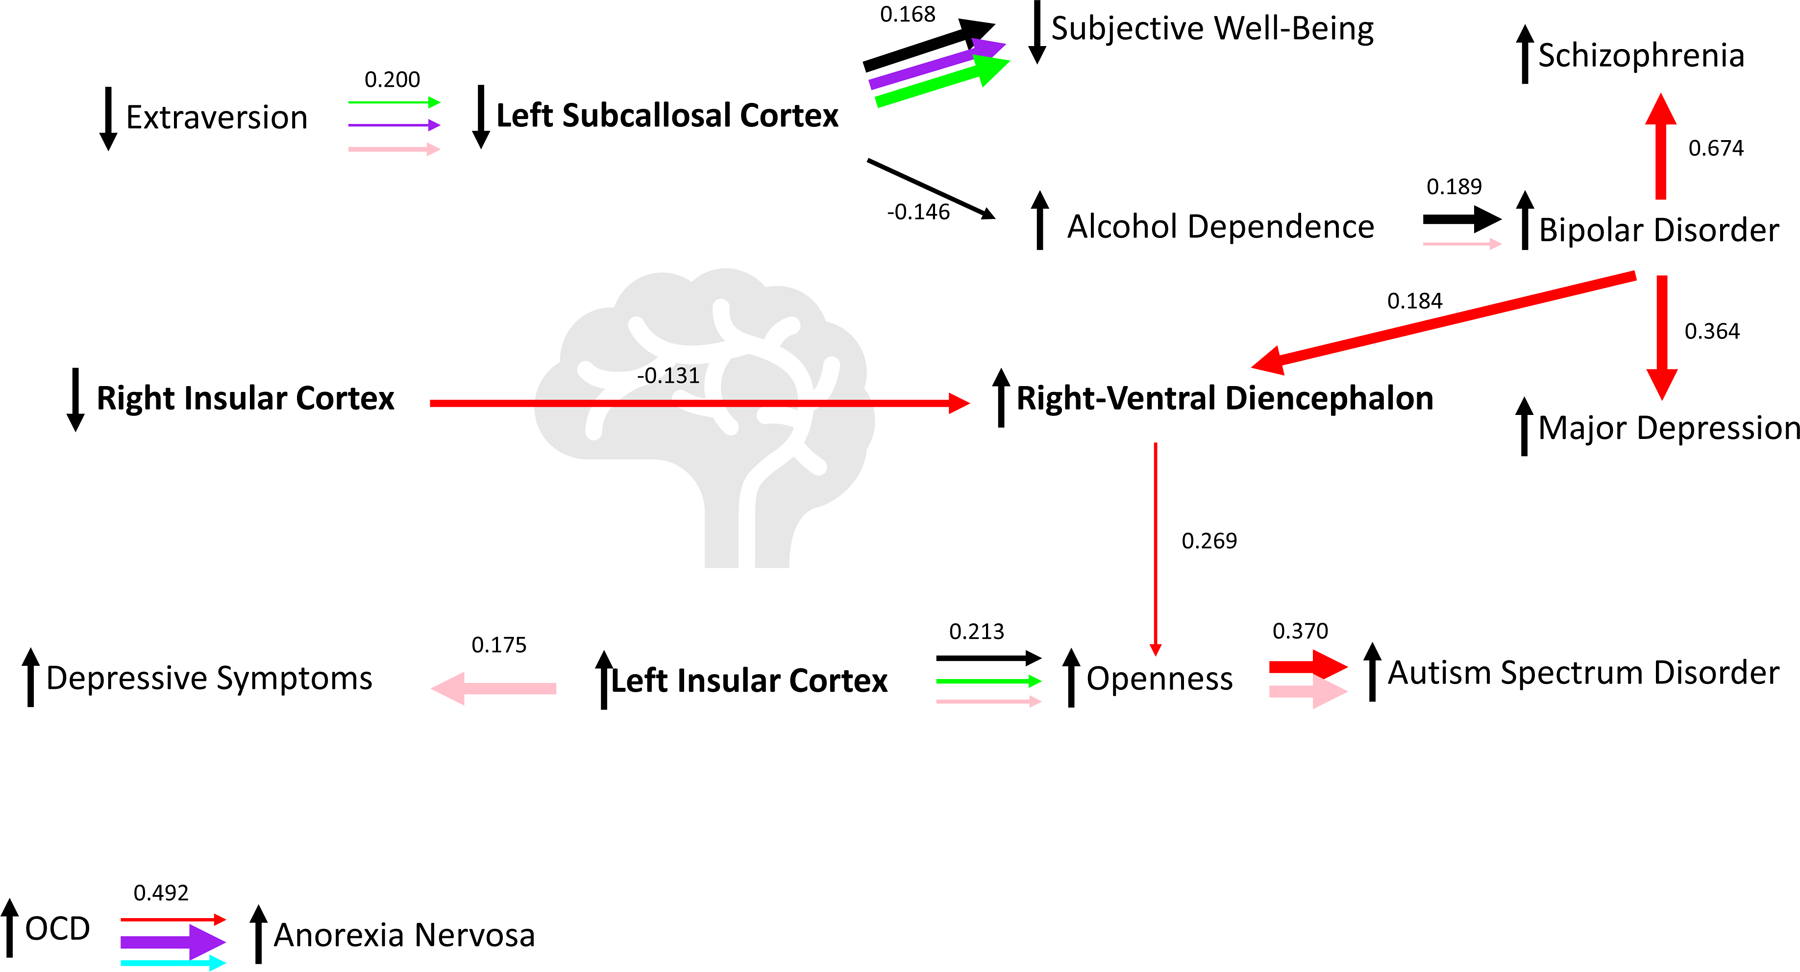
Fig. 6. Latent causal variable (LCV) relationship network.

(A) Summary of the causal relationship (derived from Fig. 5) network originating from brain imaging phenotypes (bolded text). (B) Causal relationships with no evidence of brain imaging phenotype connection in the current study (derived from Fig. 5). Arrow thickness indicates the size of the estimated causal relationship between the two traits on either end of the arrow while triangles indicate the direction of causal effect; the color of each arrow indicates the education or socioeconomic status phenotype used to condition each trait of a trait pair (black = cognitive performance; purple = educational attainment; blue = income; red = deprivation index; green = highest math class; pink = self-rated math ability); mean genetic correlations from LCV are included above each set of horizontal arrows. Sample interpretation (from A): decreased extraversion causes lower left subcallosal cortex volume after removing the effects of highest math class, educational attainment, and self-rated math ability.
