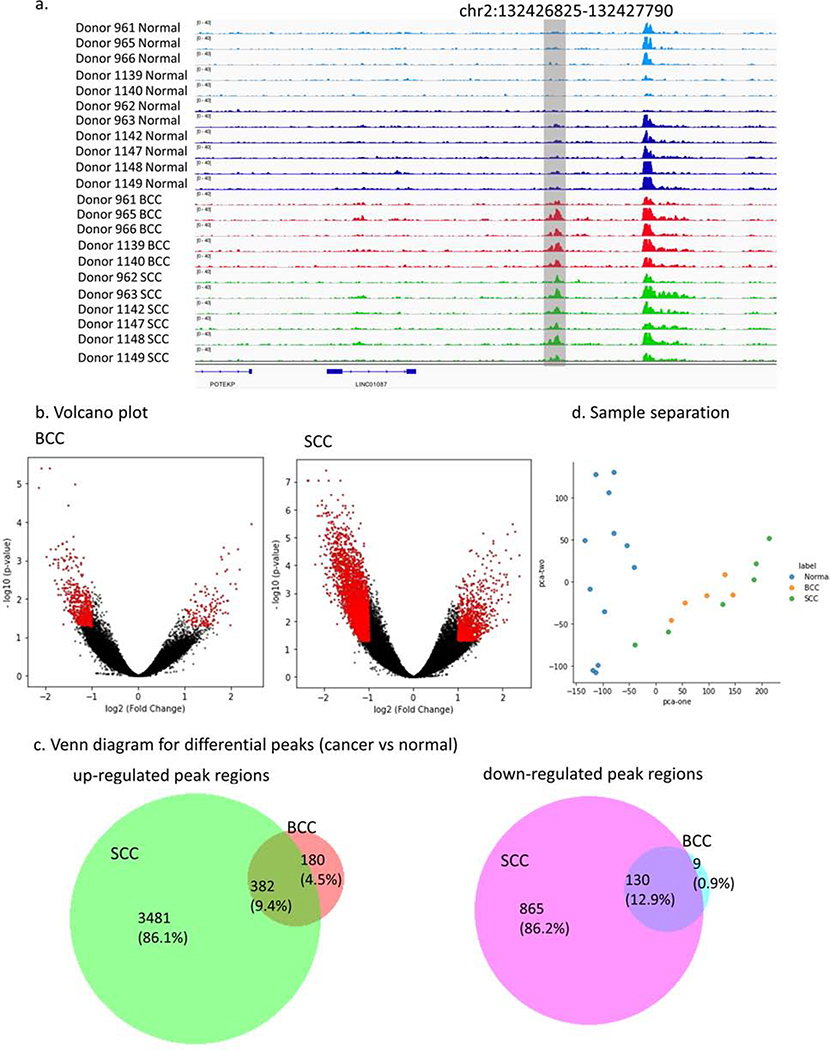
Figure 1.
H3K27ac specific regions for SCC and BCC. (a) H3K27ac signal tracks for tumor-normal samples at a single locus (chr2:132426825–132427790) show cancer-specific alteration. (b) Volcano plots show the log2 fold change and the p-value for BCC and SCC samples. Red dots are the regions with significant p-value (<5%) and absolute log2 fold change larger than 1. (c) Venn diagram for differential peaks unique and shared in BCC and SCC samples. (d) Significant H3K27ac peaks identified by DESeq2 separates tumor-normal samples using the first two principal components.

