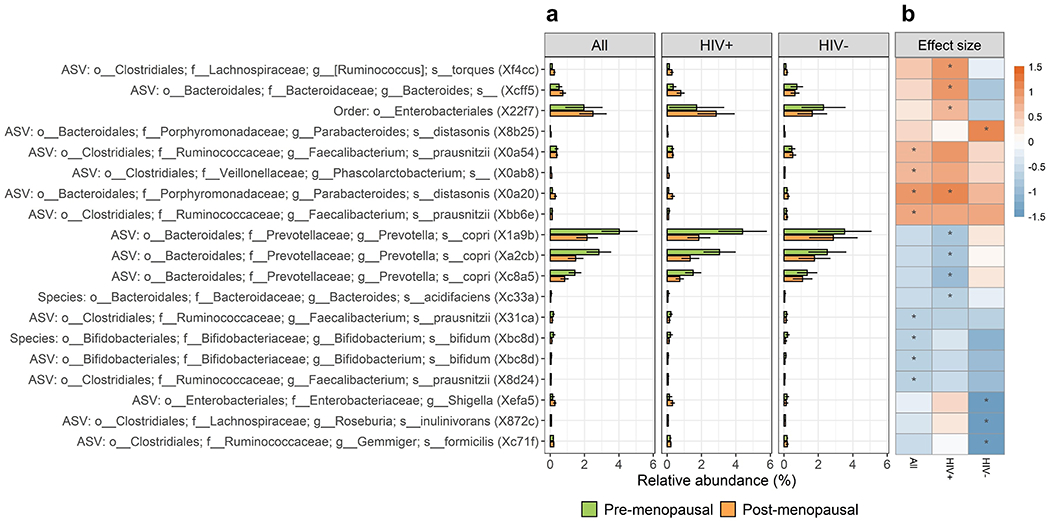
Figure 2. Microbial taxa related to menopausal status in the Women’s Interagency HIV Study.

(a) Barplots of mean (95% CI) relative abundance for taxa associated with menopausal status (post- vs. pre-menopausal) in either the unstratified or HIV-stratified ANCOM2 analysis. Taxa names are shown as “Taxonomic level: order; family; genus; species (internal study ID)”. (b) Heatmap of linear regression estimates for the effect of menopausal status on taxon abundance. Taxon abundance was clr-transformed for linear regression, and models were adjusted for age, study site, race, ethnicity, country of birth, hormonal contraceptive use, BMI, employment status, HCV status, smoking status, hypertension (and HIV status in the unstratified analysis; HIV therapy and viral load in HIV+ models). Effect size (beta) represents the difference in clr-transformed abundance between post- and pre-menopausal women. Asterisk (*) indicates significant detection in ANCOM2 analysis.
