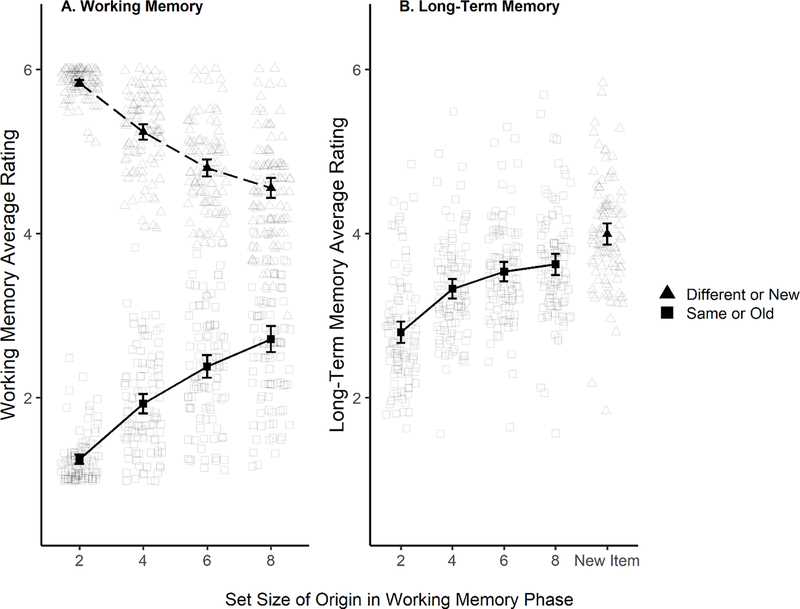
Figure 2.
Average ratings (1 – 6; 1 = sure same/studied, 2 = believe same/studied, 3 = guess same/studied, 4 = guess different/new, 5 = believe different/new, 6 = sure different/new) by Set Size in the WM task. Panel A, WM task ratings; Panel B, LTM task ratings. Circles show ratings on trials when the probe item was different or new, and diamonds show performance when the probe item was the same as one in the studied set, or old. The black circles and diamonds represent the overall mean ratings. The transparent, smaller circles and diamonds represent individual participants’ mean ratings. These are jittered to avoid overlap. Higher ratings indicate higher confidence that the item was different, and lower ratings indicate higher confidence that the item was the same. New items in the LTM phase were not studied within any set size in the WM phase. Error bars on the group means represent 95% confidence intervals.

