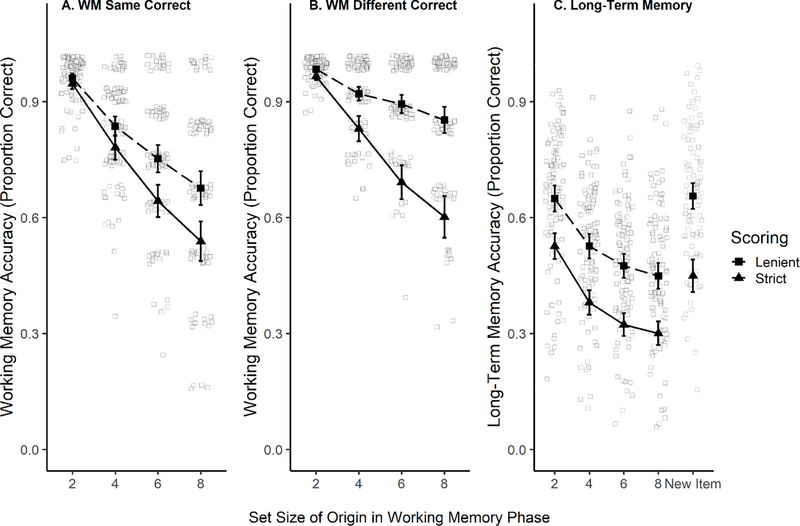
Figure 3.
Memory accuracy by WM set size. Panel A, WM hits (i.e., correctly identified ‘Same’ trials); Panel B, WM correct rejections (i.e., correctly identified ‘Different’ trials); Panel C, LTM accuracy. Black triangles and the solid line show the average WM accuracy across trials in which responses in the guessing range were always were scored as incorrect (strict scoring). The dashed line and squares show accuracy in selecting same or different regardless of participants’ exact confidence rating (lenient scoring). Light squares show individual subjects’ accuracy by set size for the lenient scoring (the points are jittered slightly in the figure to avoid overlap). Error bars represent 95% confidence intervals.

