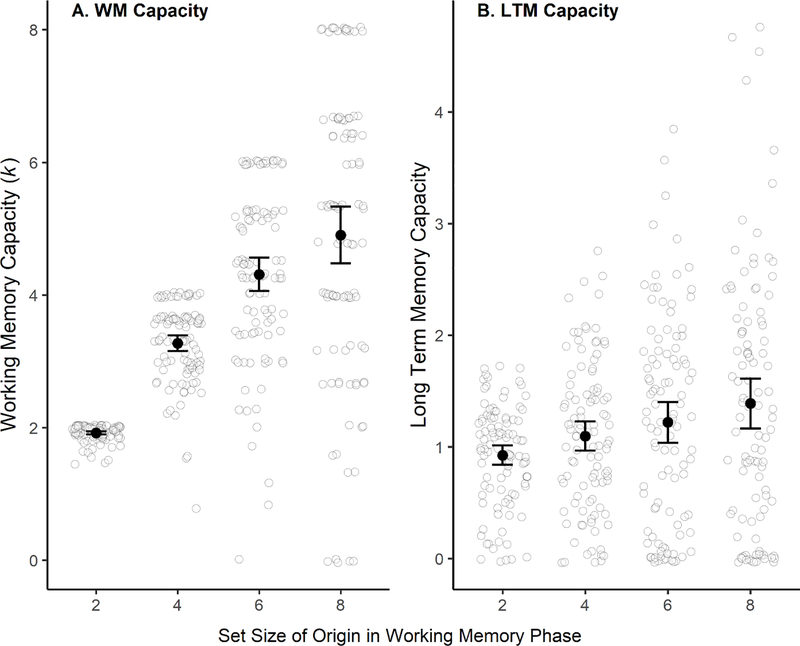
Figure 4.
Estimated items in WM and LTM. Panel A, items in WM (k). Panel B, items in LTM. Items in LTM were calculated for each participant by multiplying p(LTM) by the number of items in the relevant WM set size. P(LTM) < 0 values were recoded as 0. Black circles represent the mean number of estimated items. Grey circle outlines represent individual subject estimates and are jittered slightly to avoid overlap. Error bars on the mean are 95% confidence intervals.

