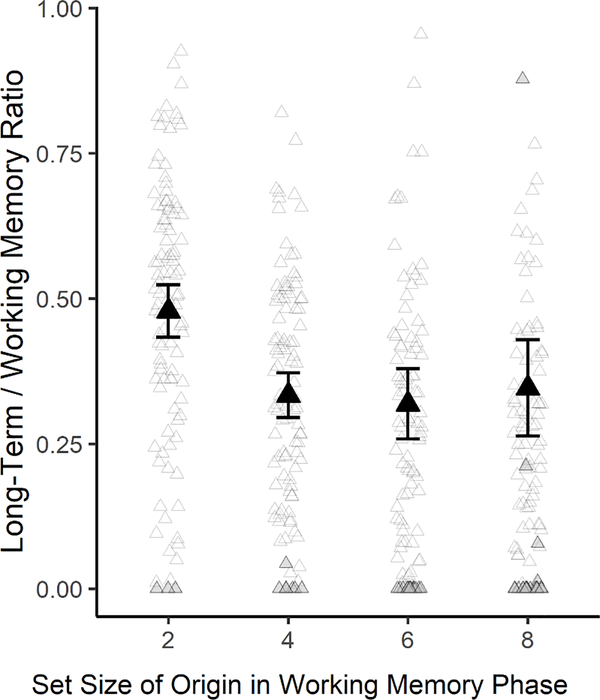
Figure 5.
LTM / WM Ratios, by WM set size. The large black triangles show the average for each set size (and error bars are 95% confidence intervals). Smaller triangle outlines show individual subject points. Grey triangles show adjusted values (either WM k < 1, and was adjusted to 1, or p(LTM) was negative and was adjusted to 0). To avoid excessive whitespace, 11 LTM / WM Ratio values > 1 were removed from this figure (4 from Set Size 6, 7 from Set Size 8); see Supplement, Figure S2 for the complete figure including these values.

