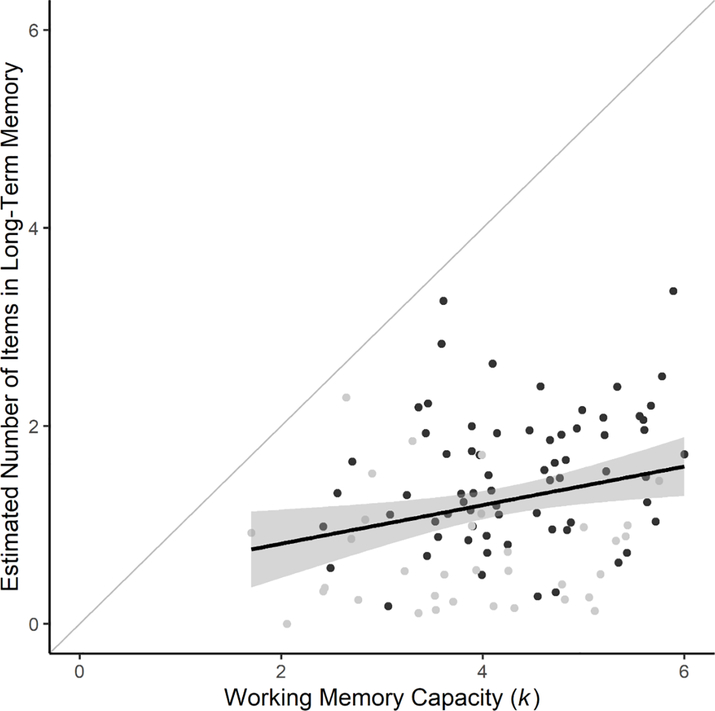
Figure 6.
Estimated Number of Items in Long-term Memory for each subject as a function of their Working Memory Capacity (k). The Long-Term Memory estimate was calculated for each participant by multiplying p(LTM) by the number of items in the WM set size, and averaging this across all set sizes, not including values from set size 2. The Working Memory capacity (k) value was obtained by averaging k from all set sizes except set size 2. Black points represent individual participants, grey points participants for which at least one p(WM) or p(LTM) value was adjusted. The black line represents a frequentist linear regression line, and the shaded area includes the 95% confidence region. The grey diagonal line represents hypothetical perfect transfer in which the number of items in LTM=WM k.

