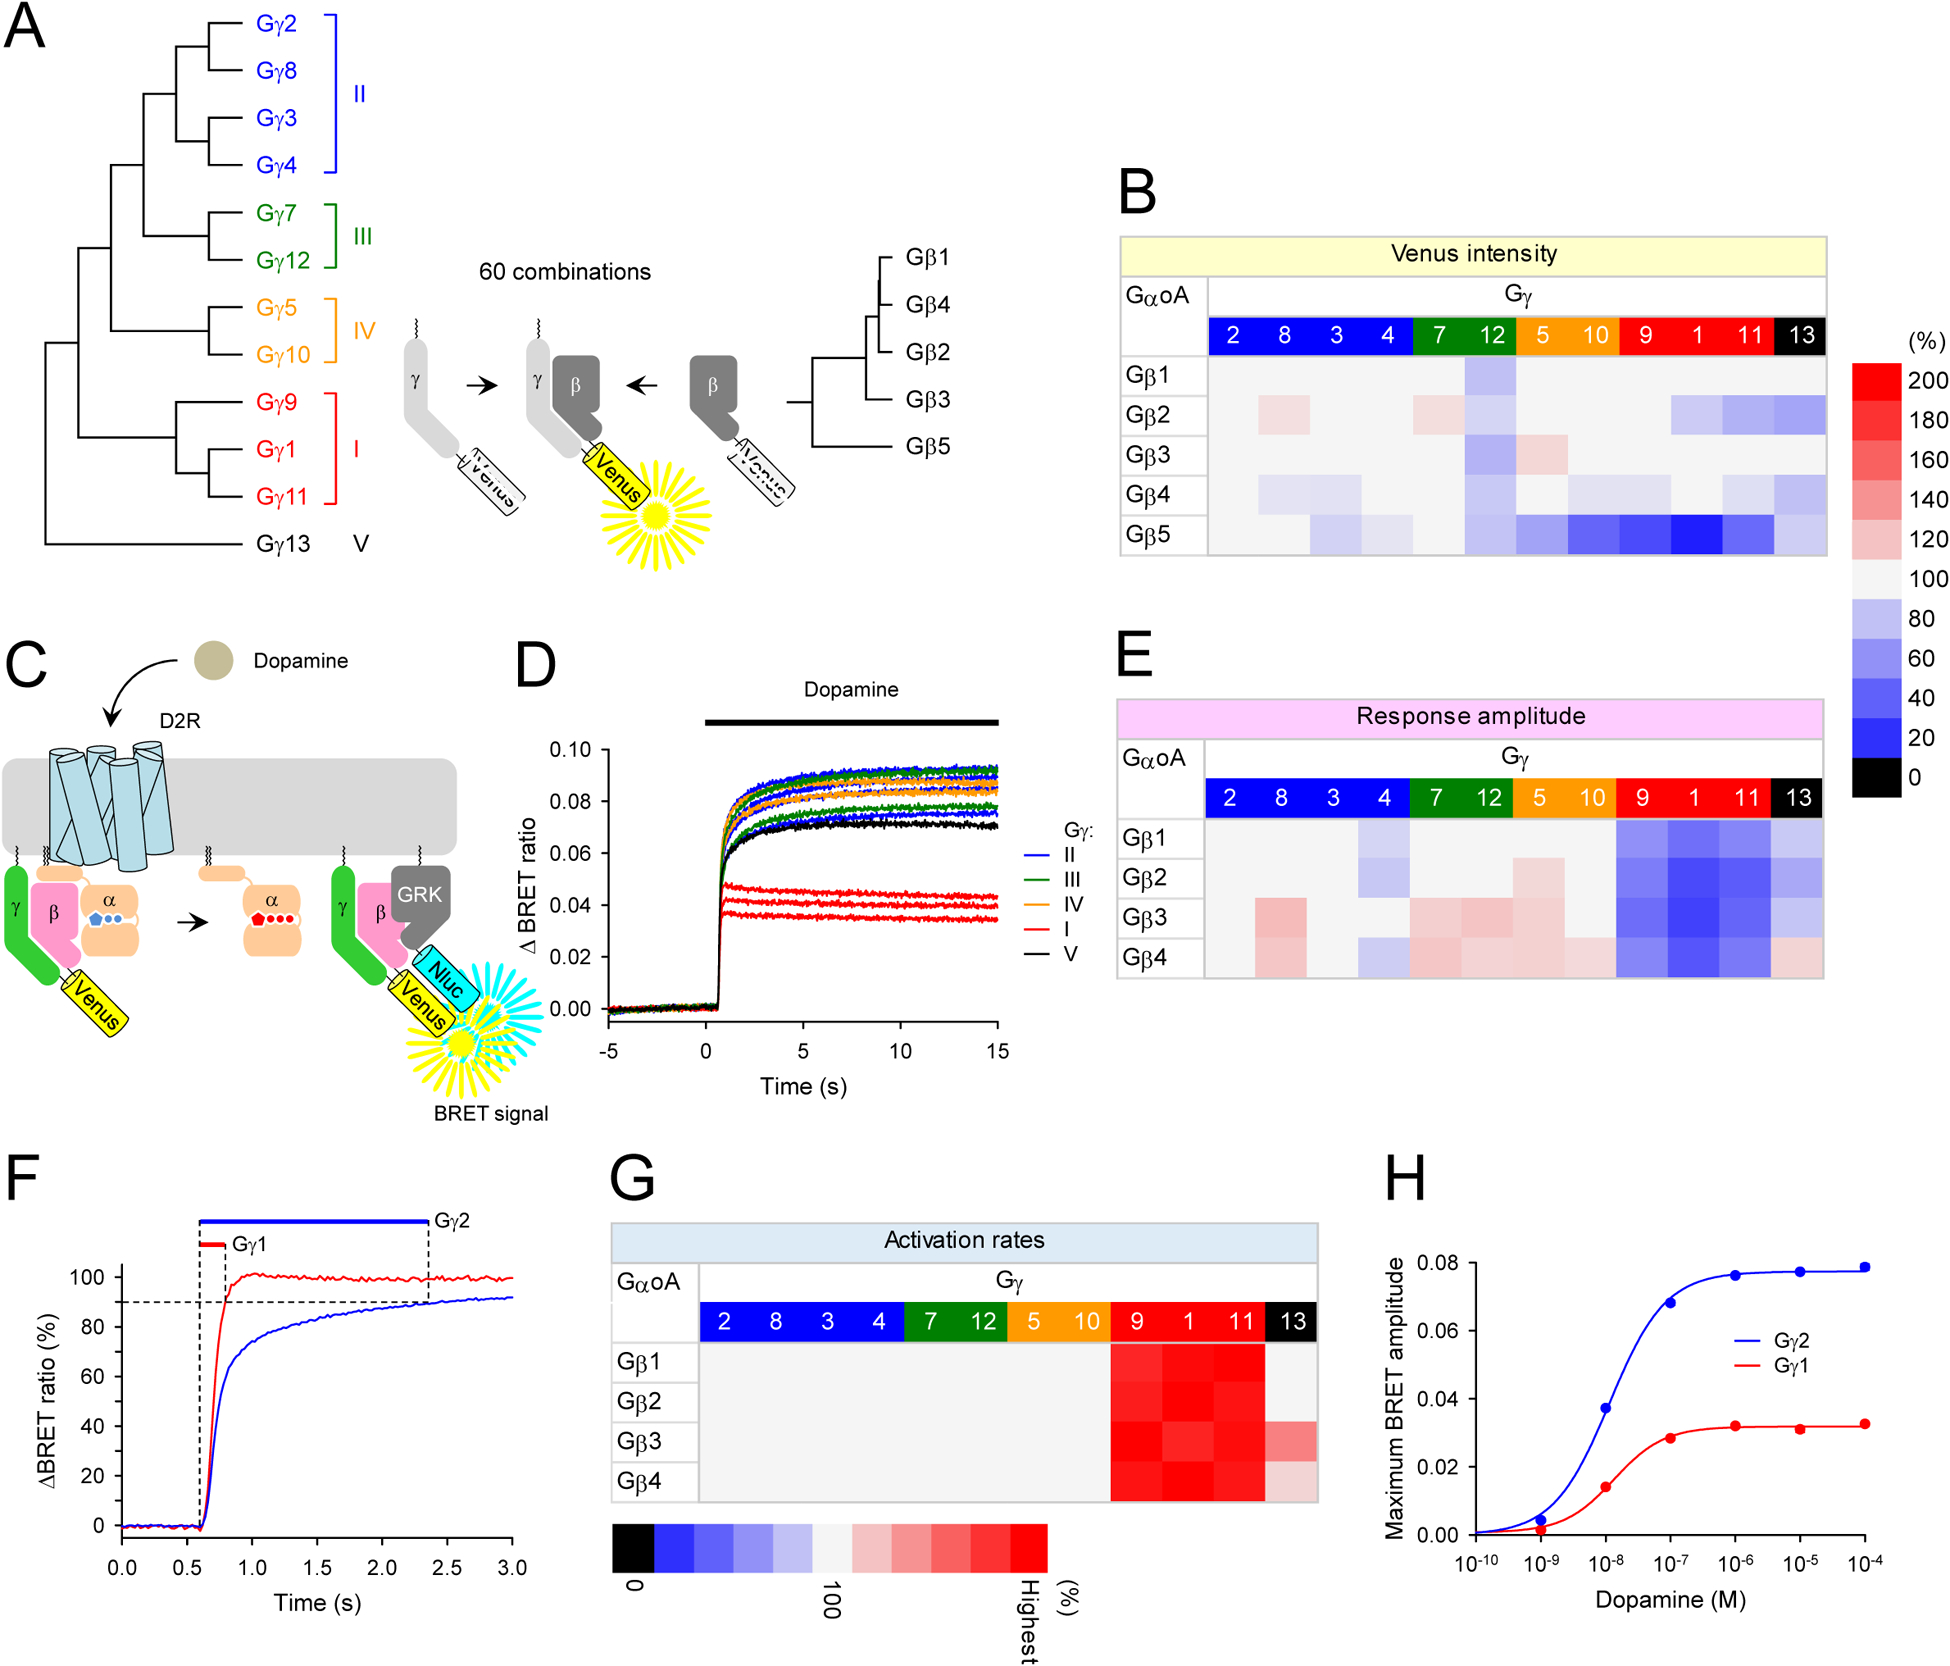
Figure 1. Exaustive functional characterization of all Gβγ dimers in living cells.

A, Schematic presentation of the BiFC assay to test Gβγ dimer formation. Two non-fluorescent fragments of Venus fused to Gβ and Gγ are brought together by dimer formation between Gβ and Gγ and produces a yellow fluorescent protein, Venus. Phylogenetic trees of Gβ and Gγ subunits are shown. For clarity, Gγ subunits were color-coded according to the classes (class I, red; class II, blue, class III, green; class IV, orange; class V, black). This color-code is used throughout this paper. B, The assessment of sixty possible Gβγ dimer formation by BiFC. The relative Venus signal intensity reflecting expression levels of Gβγ dimers in the presence of exogenous GαoA are shown as a heatmap. The values of Venus intensity were normalized to the Gγ2-containing Gβγ dimers for each Gβ subunit. C, Schematic representation of the BRET assay for real-time monitoring of G protein activity. Activation of a GPCR by an agonist leads to the dissociation of inactive heterotrimeric G proteins into active GTP-bound Gα and Venus-Gβγ subunits. The released Venus-Gβγ can then interact with the Gβγ effector mimetic masGRK3ct-Nluc-HA to produce the BRET signal. Therefore, this assay measure GPCR-induced Gβγ-effector interaction rather than direct measurement of G protein activation. D, Real-time monitoring of G protein activation by the dopamine D2 receptor (D2R). HEK293T/17 cells were transfected with D2R, GαoA, Venus 156–239-Gβ1, and masGRK3ct-Nluc-HA, together with twelve different Venus 1-155-Gγ isoforms individually. Dopamine (100 μM) was applied at 5 second timepoint and the BRET signal was followed across time. E, Functional assessment of GPCR signaling supported by the Gβγ dimers. The values of agonist-induced maximum BRET amplitude were normalized to the Gγ2-containing Gβγ dimers for each Gβ subunit and plotted as a heatmap. F, Quantification of response activation kinetics. Time to reach 90% of maximum amplitude was measured. G, The kinetics of agonist-induced G protein activation of Gβγ dimers. The values of activation kinetics (1/T90% (s−1)) were normalized to the Gγ2-containing Gβγ dimers for each Gβ subunit and plotted as a heatmap. H, Dose-response analysis of Gγ1- and Gγ2-containing Gβγ dimers. Results are expressed as the mean ± SEM (n = 3 biological replicates using independent transfections). Statistics: One-way ANOVA followed by Fisher’s LSD multiple-comparison post hoc test was carried out for panels, B, E, and G (n = 3 biological replicates using independent transfections). Statistically insignificant data (P > 0.05) was colored with gray in the heatmaps.
