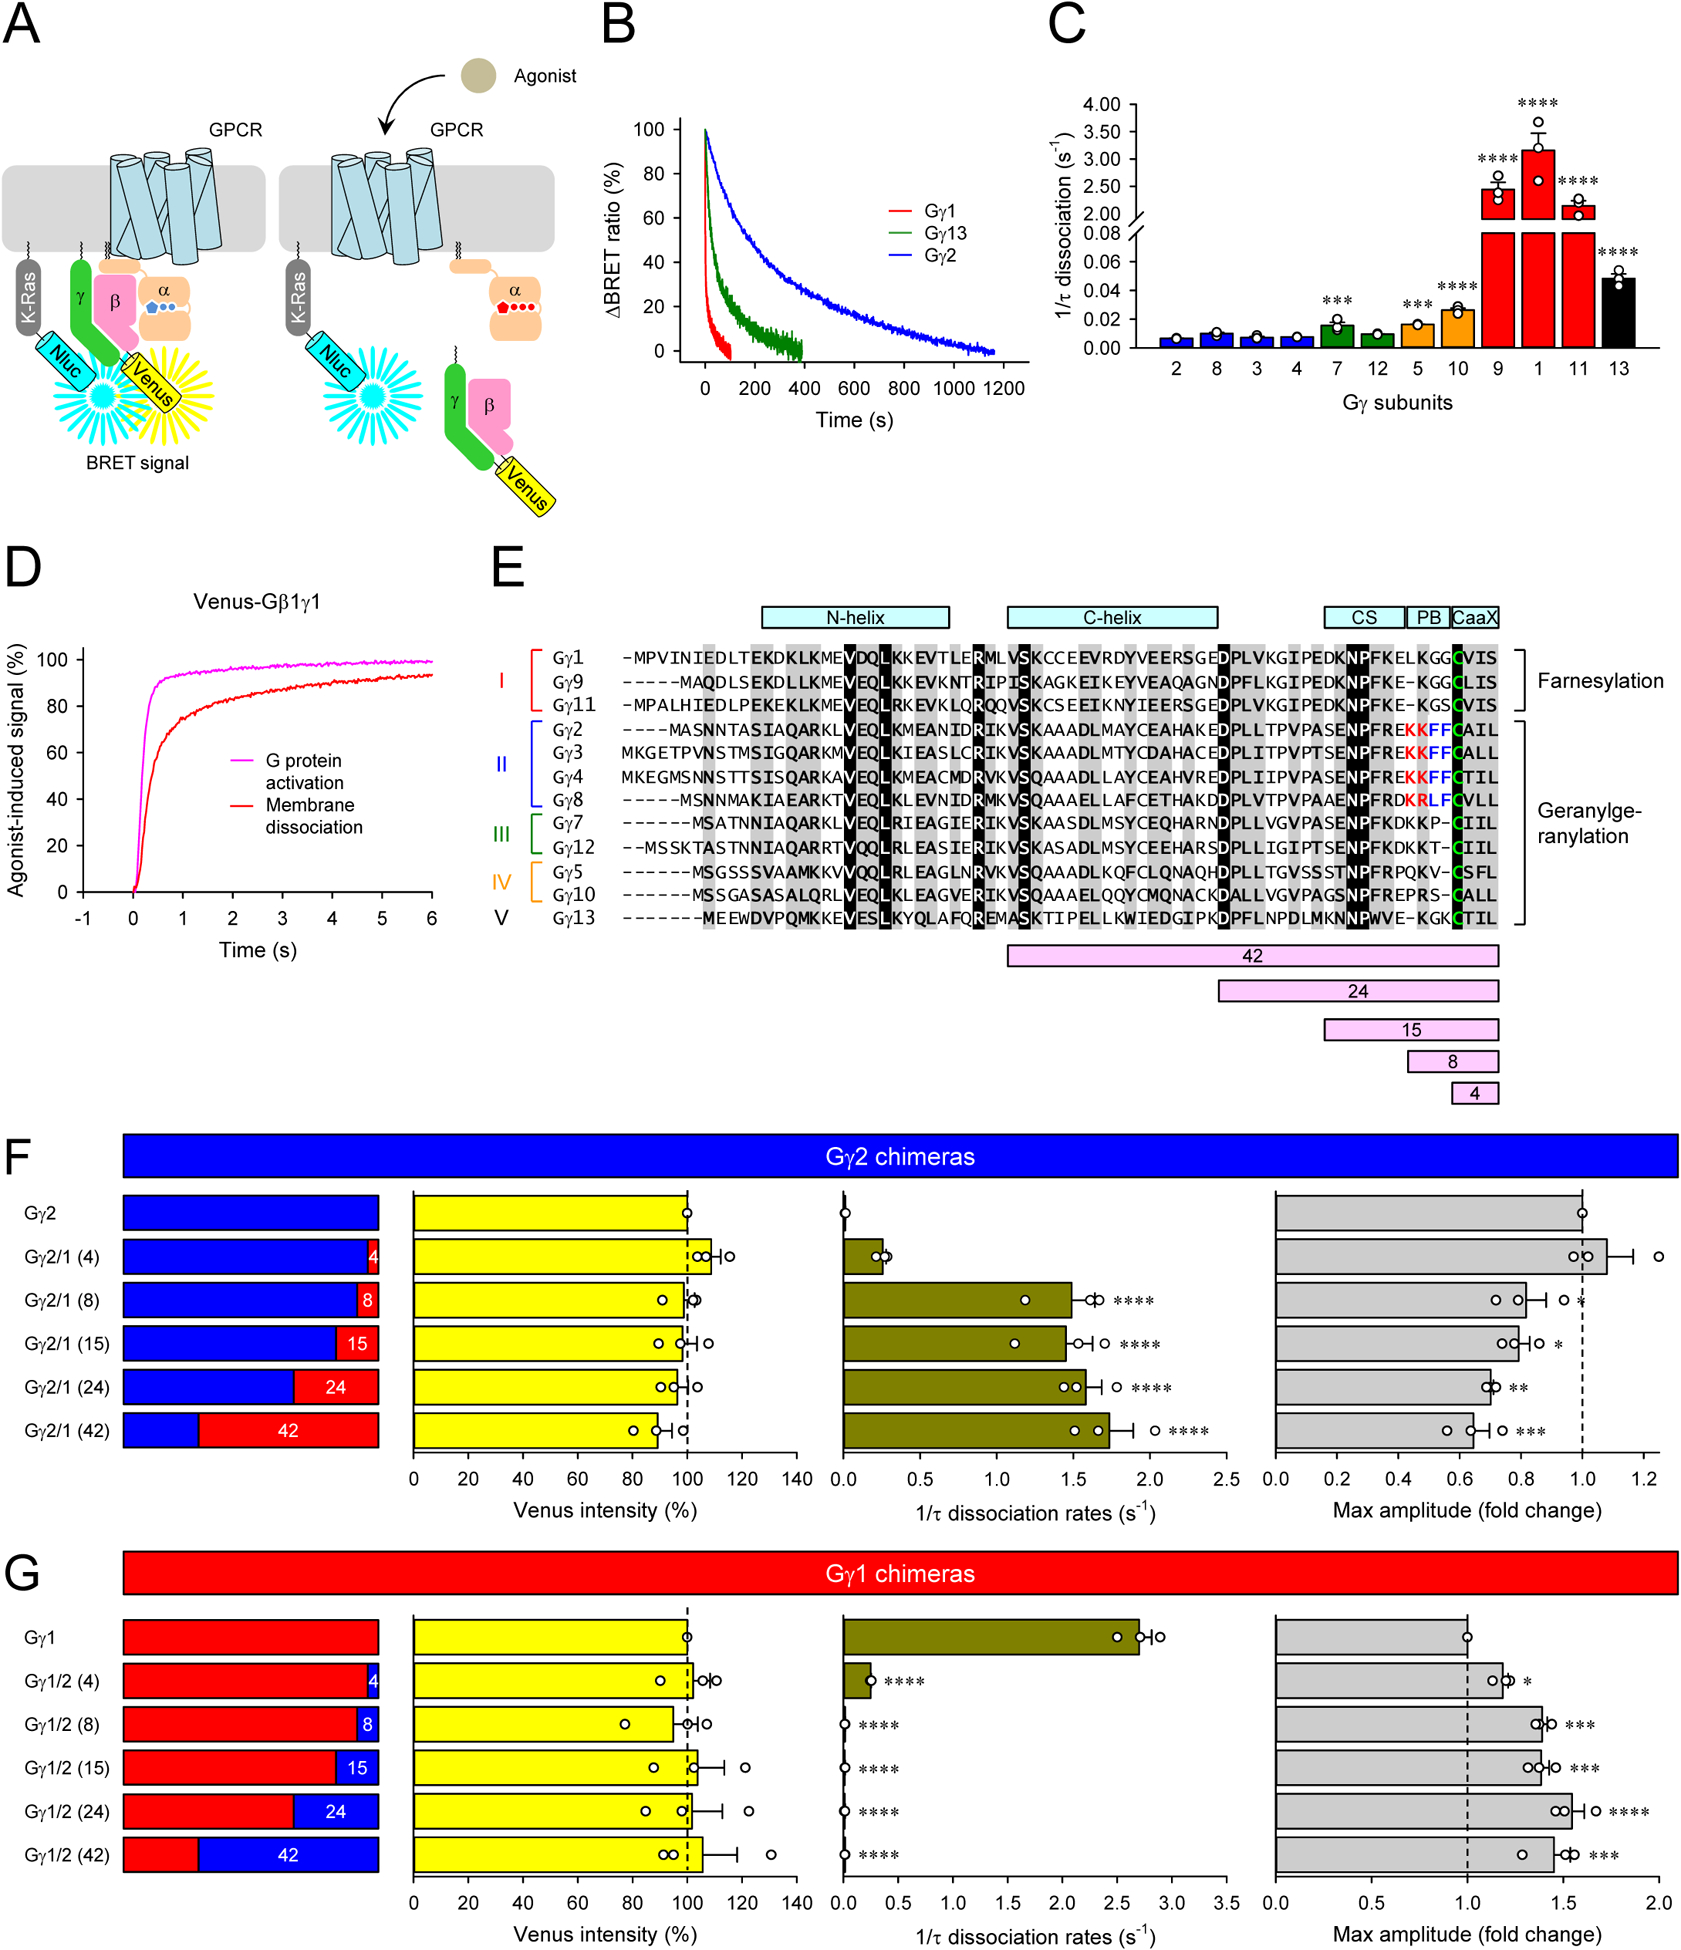
Figure 2. Impact of Gβγ composition on their dissociation from the plasma membrane and GPCR signaling efficacy.

A, Schematic presentation of the BRET assay to monitor the dissociation of Venus-Gβγ from the plasma membrane. The high density of Venus-Gβγ-containing heterotrimer and Nluc-Flag-K-Ras on the plasma membrane causes a high BRET signal. Membrane dissociation of Venus-Gβγ upon G protein activation decreases the density of Venus-Gβγ, lowering the BRET signal. B and C, Real-time monitoring of the membrane dissociation of Venus-Gβγ. HEK293T/17 cells were transfected with D2R, GαoA, Venus 156-239-Gβ1, and Nluc-Flag-K-Ras, together with twelve different Venus 1-155-Gγ isoforms individually. Dopamine (100 μM) was applied, and the BRET signal was followed across time (B). Dissociation rates were plotted as a bar graph (C). D, The time course of G protein activation (dark blue) and Venus-Gβγ dissociation (red) of Gγ1-containing Go. For comparison, the membrane dissociation of Venus-Gβγ was inverted. E, An alignment of all human Gγ subunits. Structural motifs, conformational switch (CS) and poly-basic residues (PB), etc. were highlighted on the alignment. Sequence swapped between Gγ1 and Gγ2 for chimeras were also shown at the bottom of the alignment. F and G, Venus intensity, membrane dissociation rates, and maximum BRET amplitude of Gγ1 and Gγ2 chimeras. Mean ± SEM from three independent experiments are shown as bar graphs (C, F, and G). Statistics: One-way ANOVA followed by Fisher’s LSD multiple-comparison post hoc test was carried out (n = 3 biological replicates using independent transfections) (C, F, and G): * P ≤ 0.05; ** P ≤ 0.01; *** P ≤ 0.001; **** P ≤ 0.0001.
