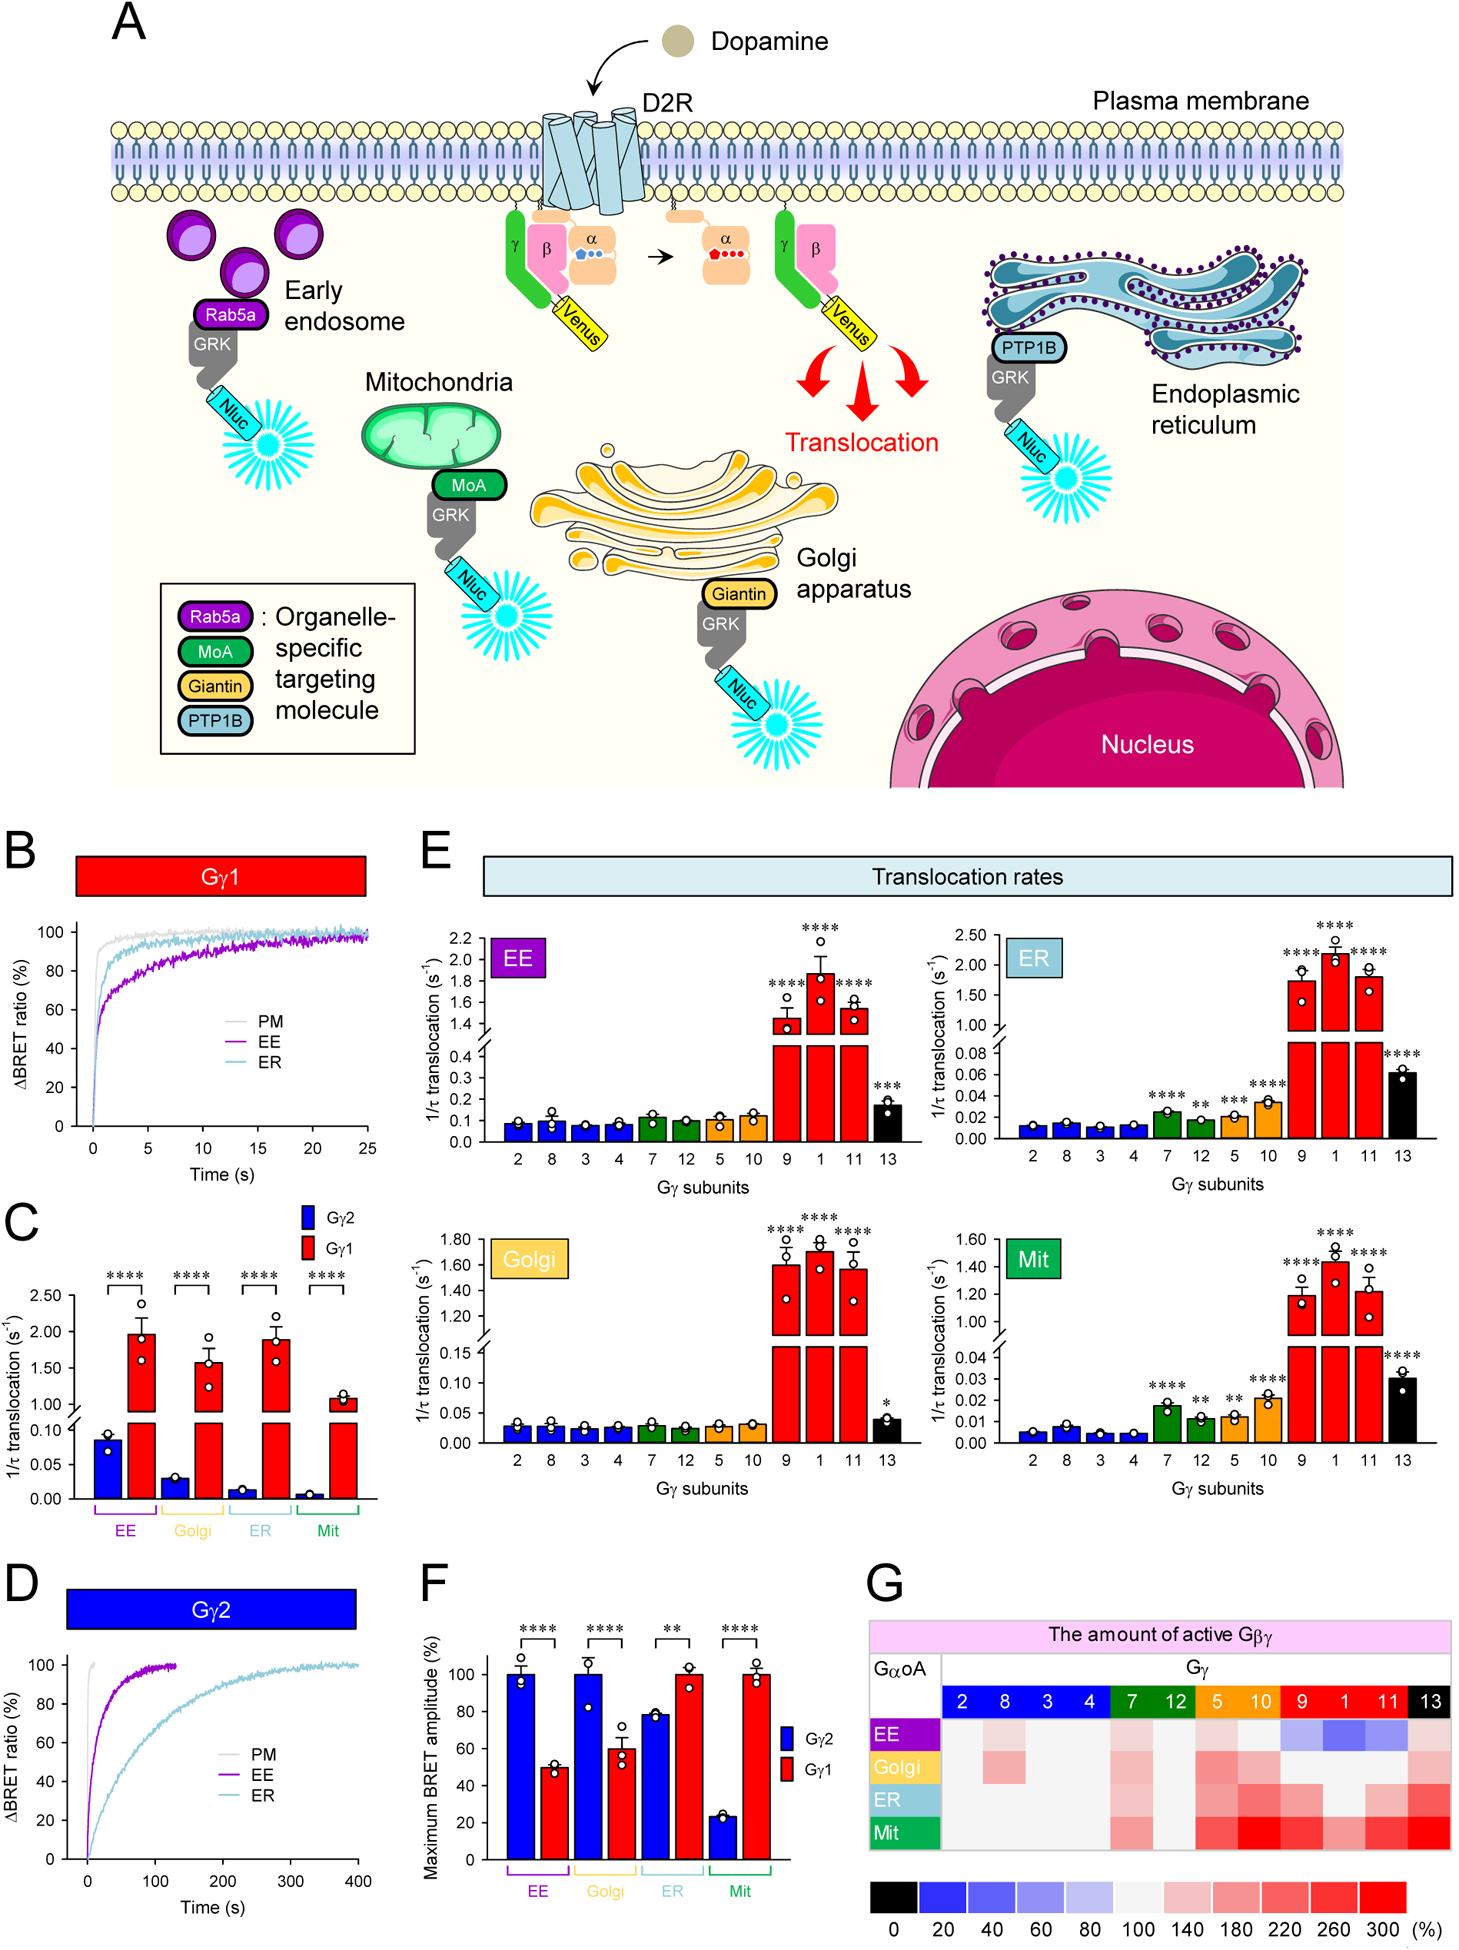
Figure 3. Signaling of Gβγ from the plasma membrane to cellular organelles.

A, Schematic presentation of the BRET assay to monitor the translocation of Venus-Gβγ from the plasma membrane to organelles. GRK3ct-Nluc-HA sensor was recruited to early endosome (EE), mitochondria (Mit), Golgi apparatus (Golgi), and endoplasmic reticulum (ER) by tagging with rab5a, monoamine oxidase A (MoA), giantin, and PTP1B, respectively. Activation of G proteins with dopamine induces dissociation of Venus-Gβγ from the plasma membrane, and it binds with GRK3ct-Nluc-HA sensors at the destination. Graphics were adapted from Servier Medical Art (http://www.servier.com). B, Real-time monitoring of the translocation of Gβ1γ1. HEK293T/17 cells were transfected with D2R, GαoA, Venus 156-239-Gβ1, and Venus 1-155-Gγ1 together with different GRK3ct-Nluc-HA sensors individually. Dopamine (100 μM) was applied, and the BRET signal was followed across time. C, Translocation rates of Gβ1γ1 and Gβ1γ2 to organelles. D, Real-time monitoring of the translocation of Gβ1γ2. E, Effect of Gγ subunits on the translocation rates of Gβγ dimers to organelles. F, Comparison of the amount of Gβ1γ1 and Gβ1γ2 on each organelle by translocation. G, Effect of Gγ subunits on the amount of Gβγ translocated to organelles. Mean ± SEM from three independent experiments are shown as bar graphs (C, E, and F). Statistics: One-way ANOVA followed by Fisher’s LSD multiple-comparison post hoc test was carried out (n = 3 biological replicates using independent transfections) (C, E, and F): * P ≤ 0.05; ** P ≤ 0.01; *** P ≤ 0.001; **** P ≤ 0.0001.
