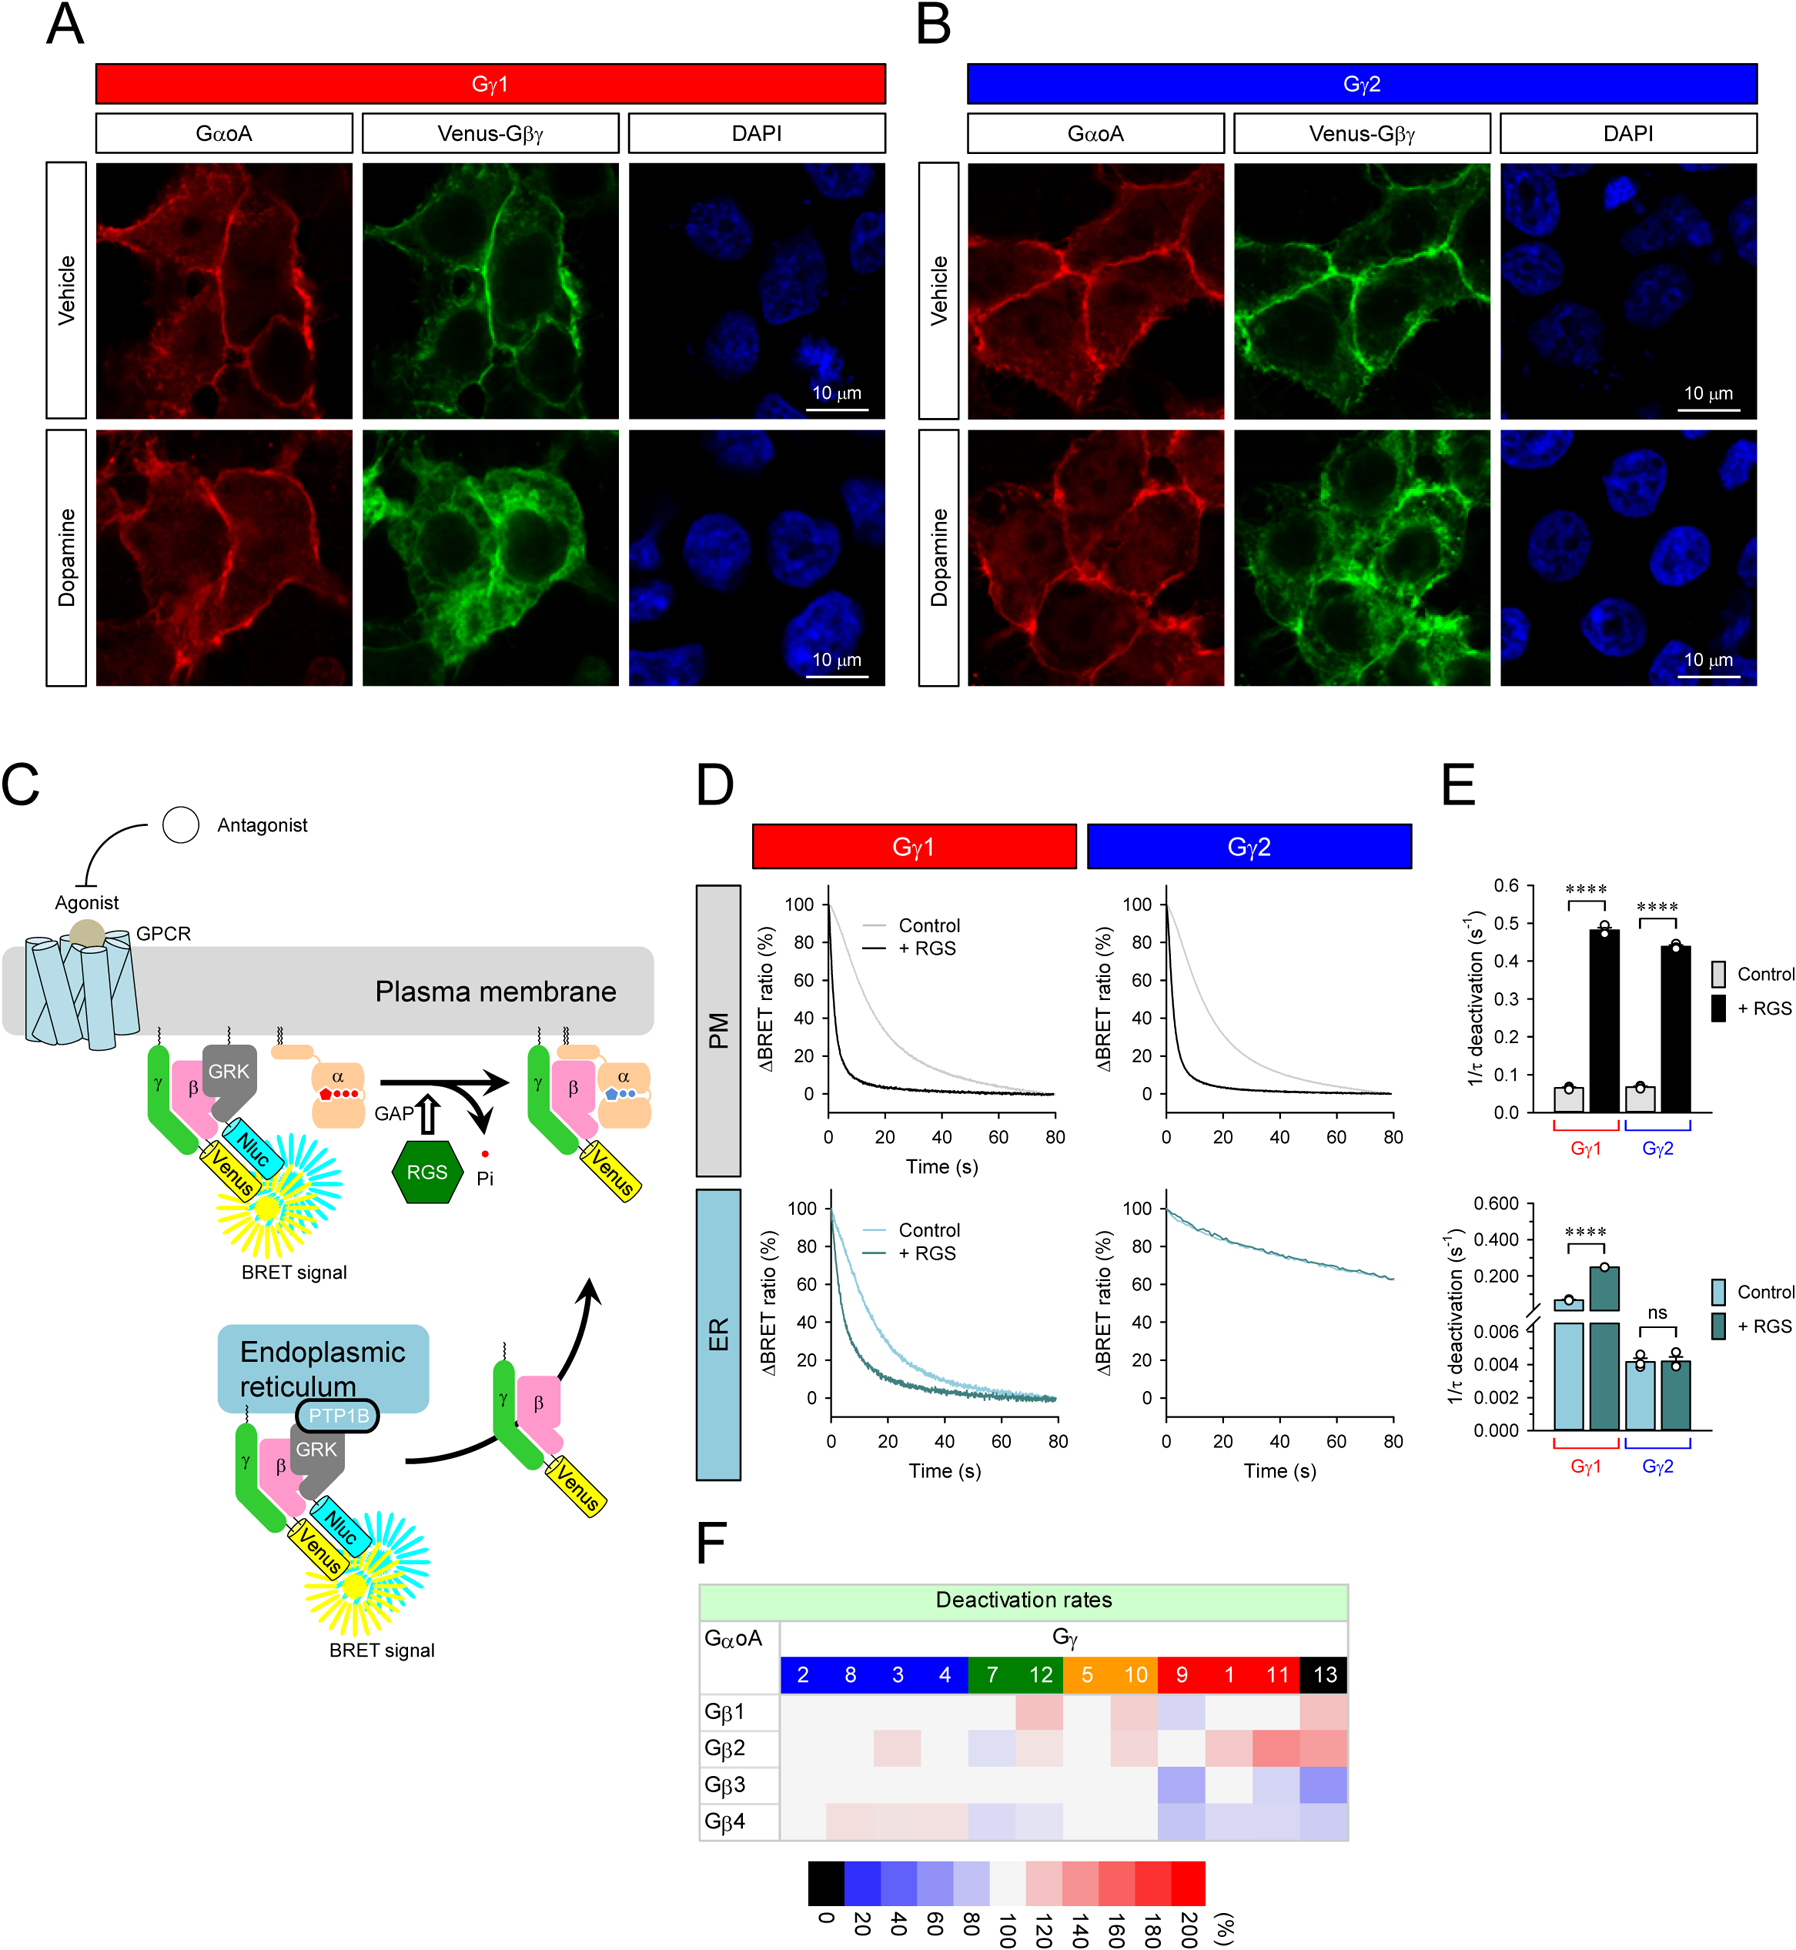
Figure 4. Mechanisms of Gβγ signaling deactivation.

A and B, Subcellular localization of GαoA and β1γ1 and Gβ1γ2 with or without prolonged stimulation of D2R. Transfected cells were stimulated with 100 μM dopamine for 10 min (bottom). Immunocytochemistry was performed with anti-Gαo antibody. The subcellular localization of GαoA and Venus-Gβγ were visualized with confocal microscopy. C, Schematic presentation of the BRET assay to monitor the deactivation of Venus-Gβγ on the plasma membrane and ER. D, Real-time monitoring of the deactivation of Gβ1γ1 and Gβ1γ2 on the plasma membrane and ER. HEK293T/17 cells were transfected with D2R, GαoA, and Venus 156-239-Gβγ with masGRK3ct-Nluc-HA or GRK3ct-Nluc-HA-PTP1B. To accelerate GTP hydrolysis rate, RGS7, Gβ5S, and R7BP were also transfected. The transfected cells were stimulated with 100 μM dopamine for 35 sec (Gγ1 on PM, Gγ2 on PM, and Gγ1 on ER) and 10 min (Gγ2 on ER) to activate G protein. Then, 100 μM haloperidol was applied to inhibit the activity of D2R. E, The deactivation rates of Gβ1γ1 and Gβ1γ2 on the plasma membrane (top) and ER (bottom). Statistics: One-way ANOVA followed by Fisher’s LSD multiple-comparison post hoc test was carried out (n = 3 biological replicates using independent transfections): * P ≤ 0.05; ** P ≤ 0.01; *** P ≤ 0.001; **** P ≤ 0.0001. F, Effects of Gβγ on G protein deactivation rate on the plasma membrane. Deactivation rates of Go when complexed with 48 different Gβγ dimers are reported as heatmaps. One-way ANOVA followed by Fisher’s LSD multiple-comparison post hoc test was carried out (n = 3 biological replicates using independent transfections). Statistically insignificant data (P > 0.05) are colored in gray.
