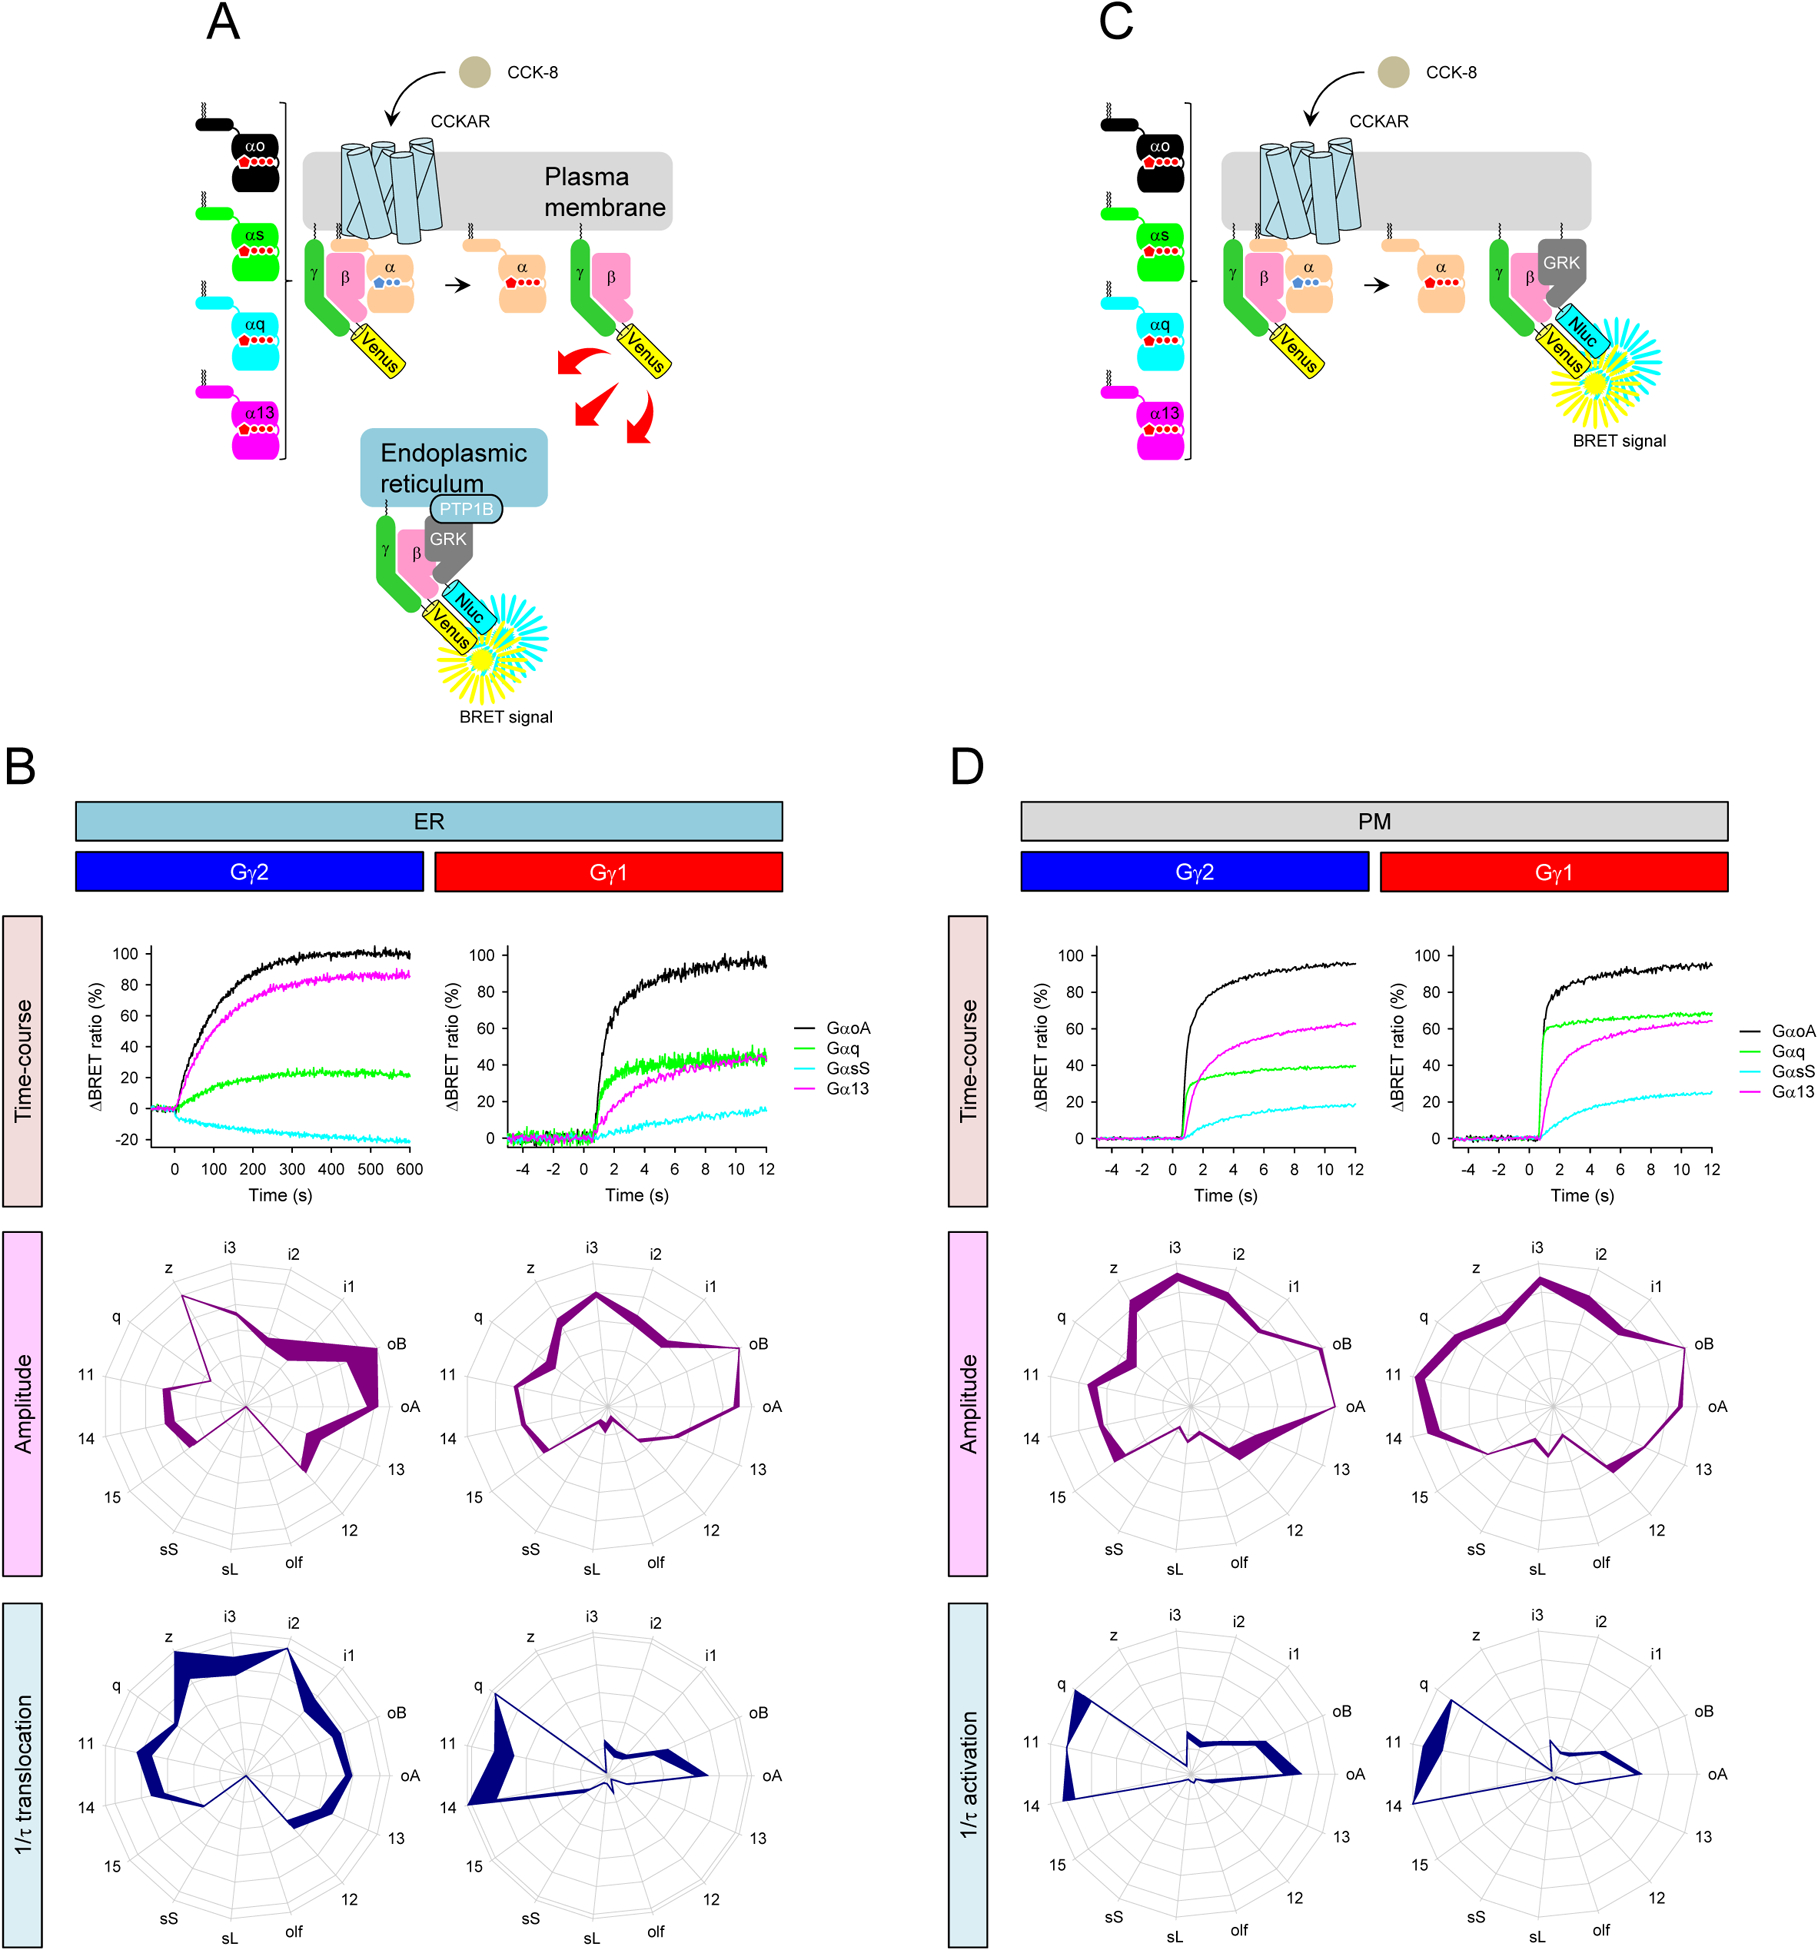
Figure 5. Impact of Gβγ identity on location-specific GPCR fingerprints.

A, Schematic presentation of the BRET assay to monitor the recruitment of Venus-Gβγ to the ER induced by CCKAR which couples to diverse set of G proteins. B, Real-time monitoring of the translocation of Gβ1γ1 (right) and Gβ1γ2 (left) from the plasma membrane and ER (top). Profiling of CCKAR-induced translocation of Gβ1γ1 and Gβ1γ2 to the ER through 15 Gα subunits in extent and speed. The maximum amplitudes (purple) and translocation rate constants (dark blue) from 15 different G proteins were normalized to the largest value and plotted in the wheel diagrams. C, Schematic presentation of the BRET assay to monitor the G protein-coupling profiles of CCKAR on the plasma membrane. D, Real-time monitoring of the CCKAR-induced activity of Gβ1γ1 (right) and Gβ1γ2 (left) on the plasma membrane (top). Profiling amplitudes and kinetics of CCKAR-induced translocation of Gβ1γ1 and Gβ1γ2 to the ER in the presence of 15 Gα different subunits. The maximum amplitudes (purple) and translocation rate constants (dark blue) from 15 different G proteins are normalized to the largest value and plotted in the wheel diagrams. Line thickness represents the SEM of three technical replicates performed independently (B and D).
