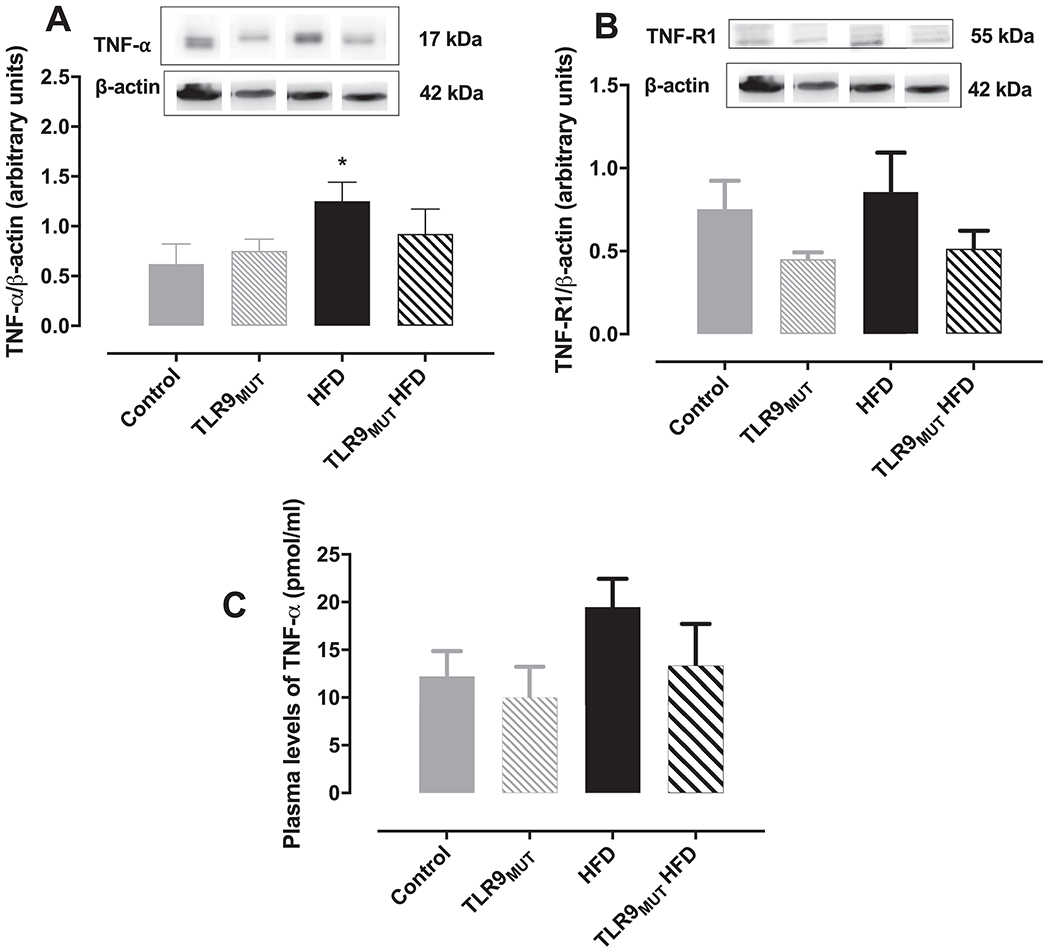
Figure 3.

Expression of TNF-α (panel A; n=4) and TNF receptor 1 (TNF-R1; panel B; n=8) in the corpus cavernosum of WT and TLR9MUT mice fed standard chow or high fat diet (HFD). Graph C represents the circulating levels of TNF-α (n=5-6). Data are mean ± S.E.M of n mice.
*P<0.05 compared to WT mice. The full image of the membranes is available in the supplementary file 1.
