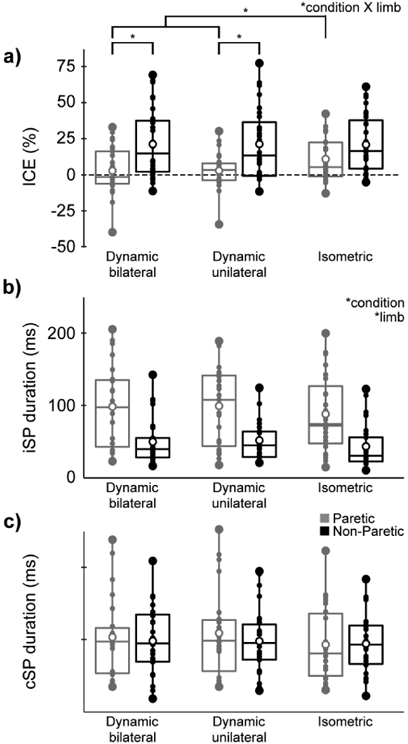
Fig 3. Primary outcome measures.

Box and whisker plots with values for the paretic (gray) and non-paretic limb (black) during dynamic bilateral ankle movement (left), dynamic unilateral ankle movement (middle), and isometric unilateral ankle contraction (right). a) Index of corticospinal excitability (ICE), b) ipsilateral silent period (iSP), c) contralateral silent period (cSP). Small dots represent individual data, while large dots represent the minimum and maximum values. Open circles represent mean values. Boxes range from the 1st to the 3rd quartile, and the middle horizontal lines represent the median values. Significant ANOVA effects are listed at the top right of each subfigure. Significant post-hoc t-tests to compare between conditions are shown in subfigure a.
