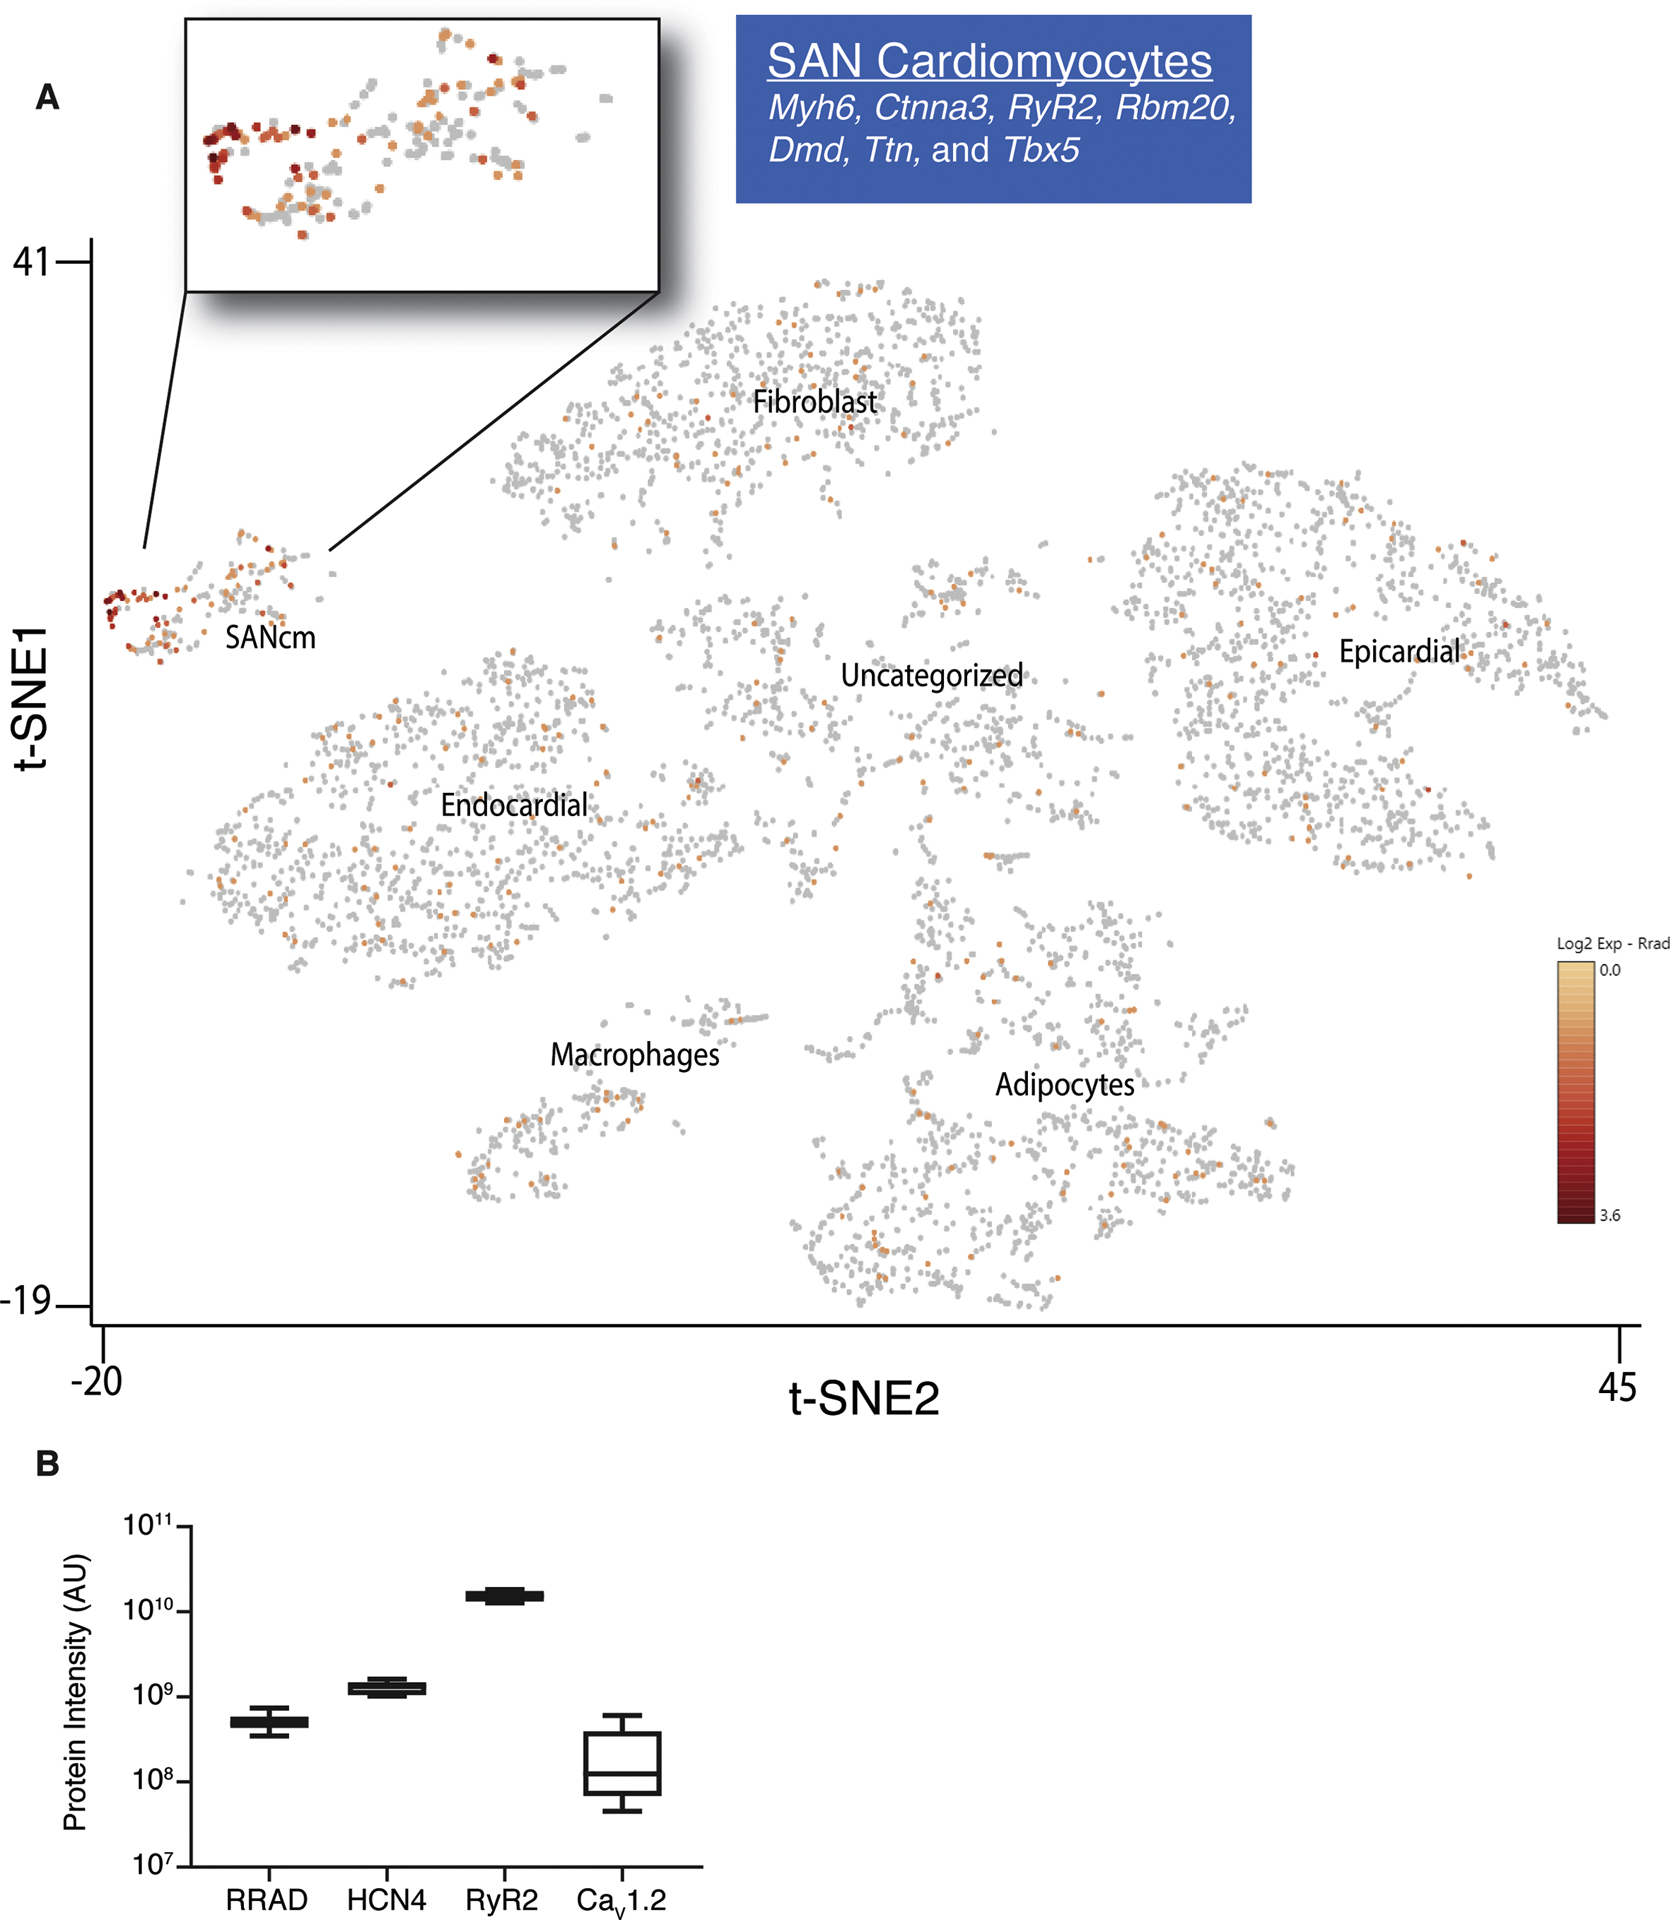
Figure 1. RRad is expressed in SANcm.

A) Two-dimensional t-SNE (Stochastic Neighbor Embedding) plot outlines the major populations of the sinus node. Analysis of database from Linscheid et al. 2019. Each point represents a single nucleus. Cell populations are colored according to intensity of RRad expression, with an expanded view of the SANcm. B) Quantification of data mined from Linscheid et al. 2019 of the expression of Rad protein in relation to other proteins known to be expressed specifically in SANcm (HCN4) and cardiomyocytes in general (RyR2 and CaV1.2).
