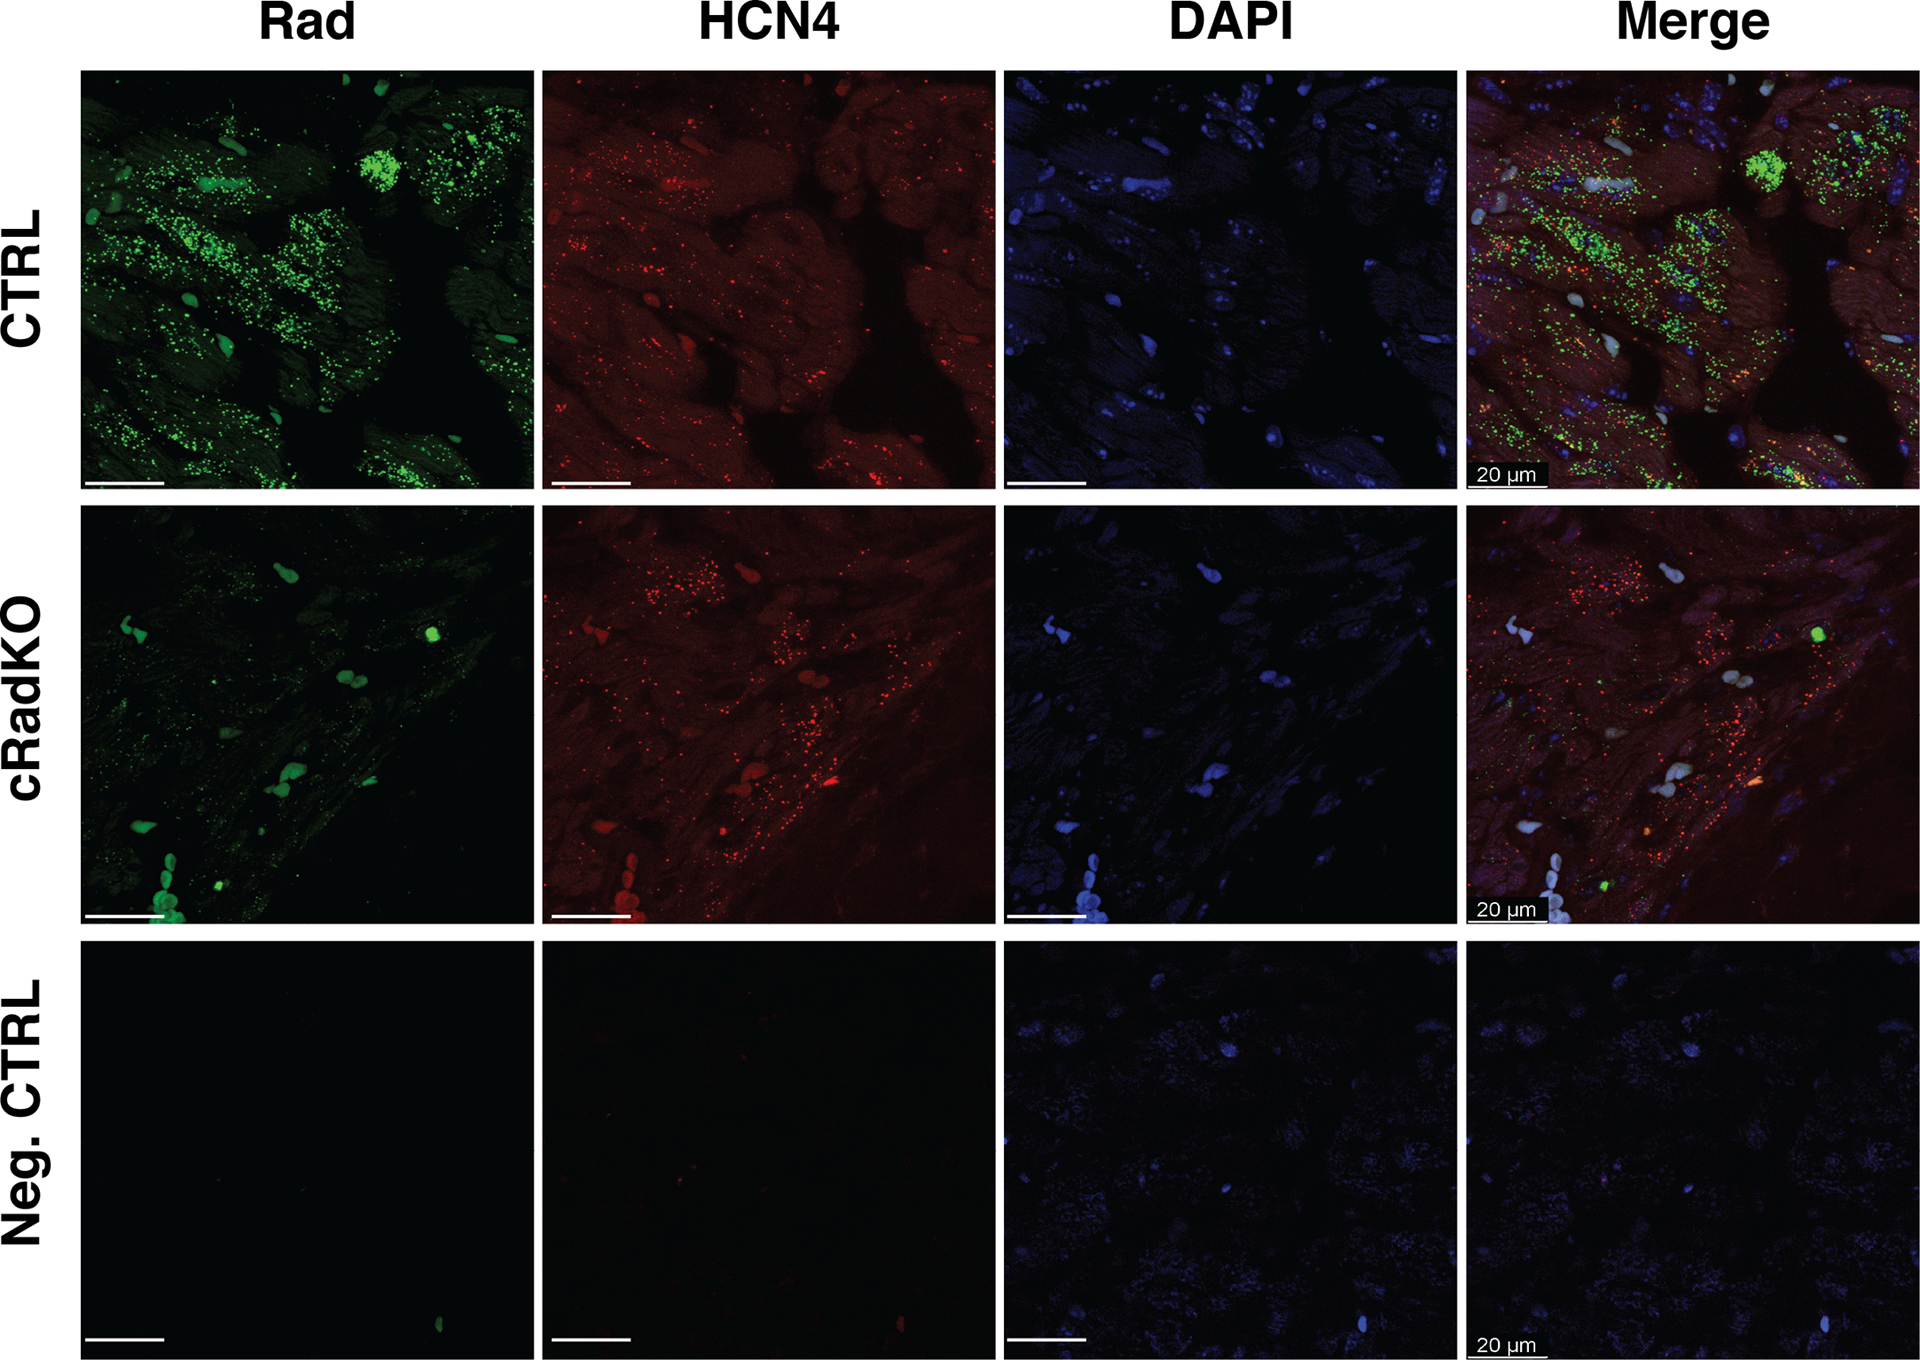
Figure 2. Rad expression in SANcm.

Representative images of single-molecule fluorescence in situ hybridization against Rad (green) and HCN4 (red) in CTRL (top images) and cRadKO (middle images) in SANcm. Lower panel, probe for bacterium DapB gene serves as a background control (bottom images). Heart tissue was collected >2 weeks after tamoxifen treatment. Tissue samples were stained with DAPI (blue). Images of channels merged displayed on the right. Representative of 3 CTRL and 3 cRadKO hearts. Scale bar: 20 μm.
