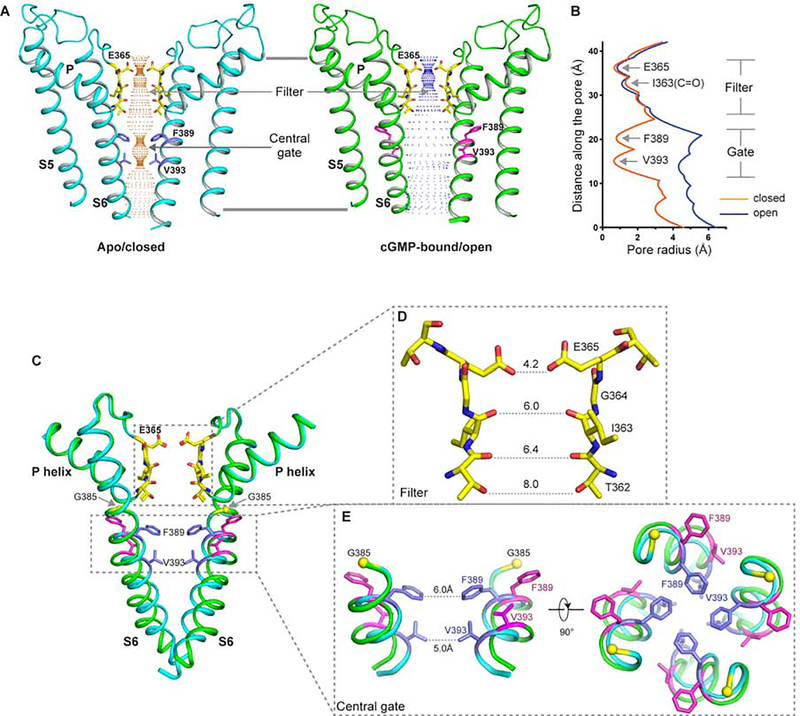
Figure 2. Ion conduction pore of human CNGA1.
See also Figure S7
(A) The ion conduction pore of the apo closed (left) and ligand-bound open (right) CNGA1 with front and rear subunits removed for clarity. Central ion pathway is marked with dotted mesh. Key gating and filter residues are shown as sticks.
(B) Pore radius along the central axis in the open (in blue) and closed (in orange) states.
(C) Structural comparison of the pore region between the open (green) and closed (cyan) states. Only the pore helices, filters and S6 helices from two diagonal subunits are shown in the superposition. Yellow spheres mark the Cα atoms of G385s.
(D) Selectivity filter of CNGA1 with atom-to-atom distances in Å.
(E) Structural comparison of the central gate between the apo closed (cyan) and cGMP-bound open state (green) in side (left) and down (right) views.

