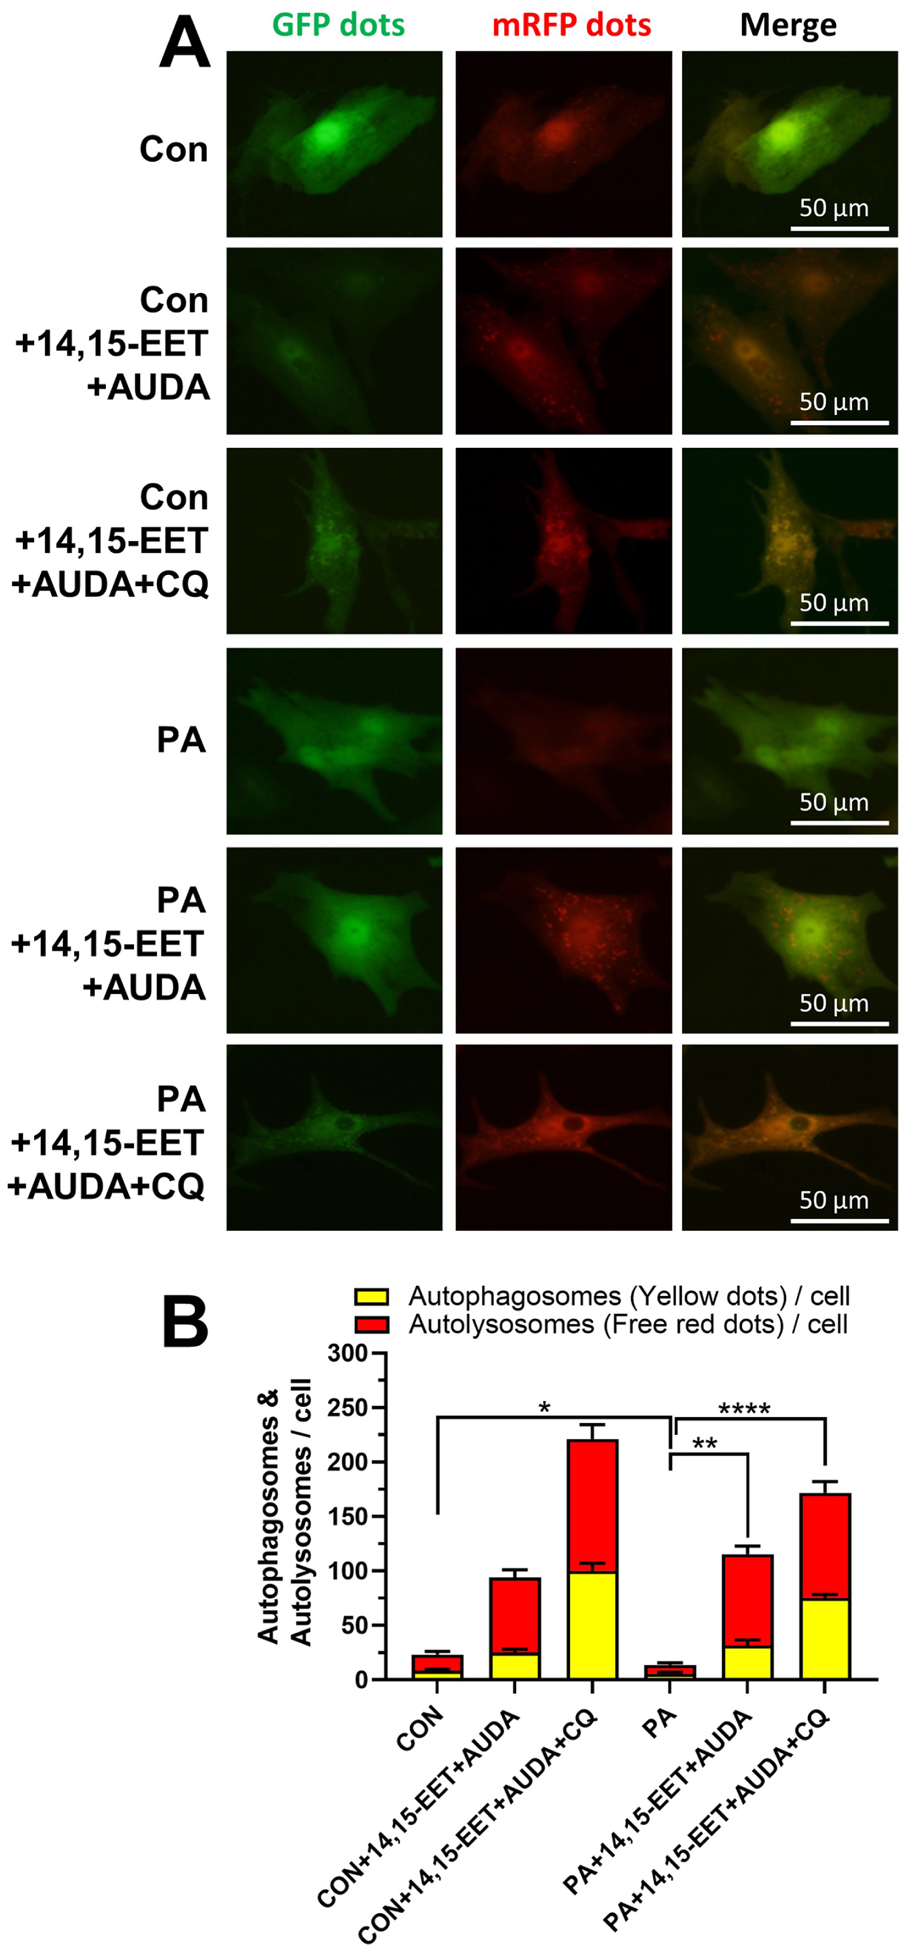
Fig. 6. sEH substrate EET plus sEH inhibitor alleviated PA-induced suppression on autophagic flux.

Primary mouse neonatal WT cardiomyocytes were incubated with PA, PA+14,15-EET+AUDA or PA+14,15-EET+AUDA+CQ and without PA as controls. (A) Representative confocal immunofluorescence images of mRFP-GFP-LC3 puncta are shown to present autophagic flux in cardiomyocytes. (B) Quantification of autophagy flux. Graph bars show the mean numbers of autophagosomes (yellow dots) and autolysosomes (red dots) per cell. Scale bars indicate 50 μm. *p < 0.05, **p<0.01, ****p < 0.001. n=3 per group. PA, palmitic acid; AUDA, sEH inhibitor; CQ, chloroquine; CON, no PA control; mRFP, monomeric red fluorescent protein; GFP, green fluorescent protein.
