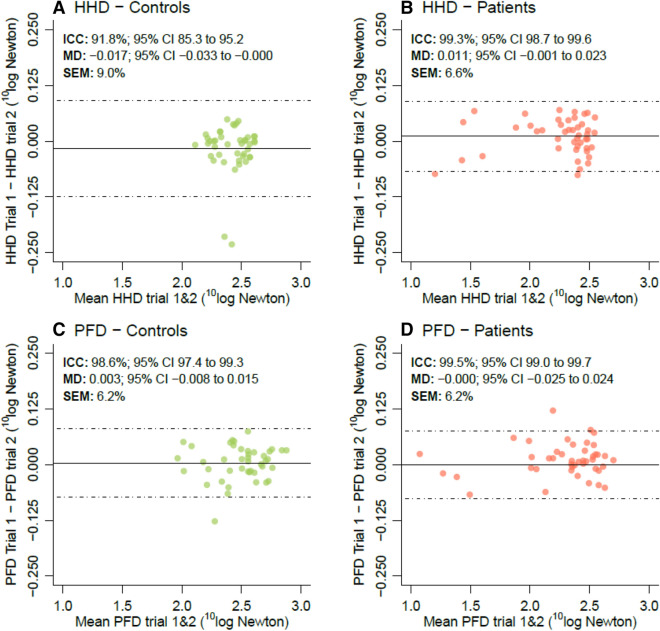
Fig. 3.
Bland–Altman plots for test–retest reliability. Bland–Altman plots of the HHD (a–b) and PFD (c–d) for non-neurological controls and patients with MND, respectively. Due to the heteroscedastic nature of the data, we applied a 10log-transformation. MD mean difference between trials 1 and 2, ICC intraclass correlation coefficient, SEM standard error of measurement, expressed as percentage of the mean on the original scale (Newton) [35]

