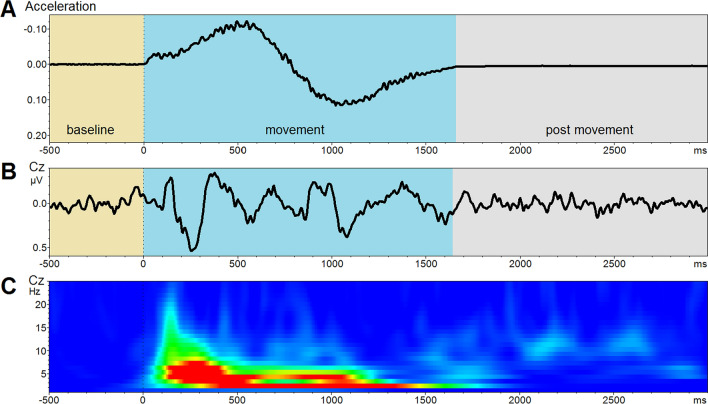
Fig. 2.
a Acceleration profile used for this experiment. b Grand Average of all conditions and subjects. Due to different vestibular thresholds across the subjects and due to a less restrictive head fixation the VestEPs described by other studies (P1, N1, P2) are less pronounced. c Time–frequency representation of the time course. A strong signal increase during the movement can be observed in the delta (1–4 Hz) and theta-band (4–7 Hz)

