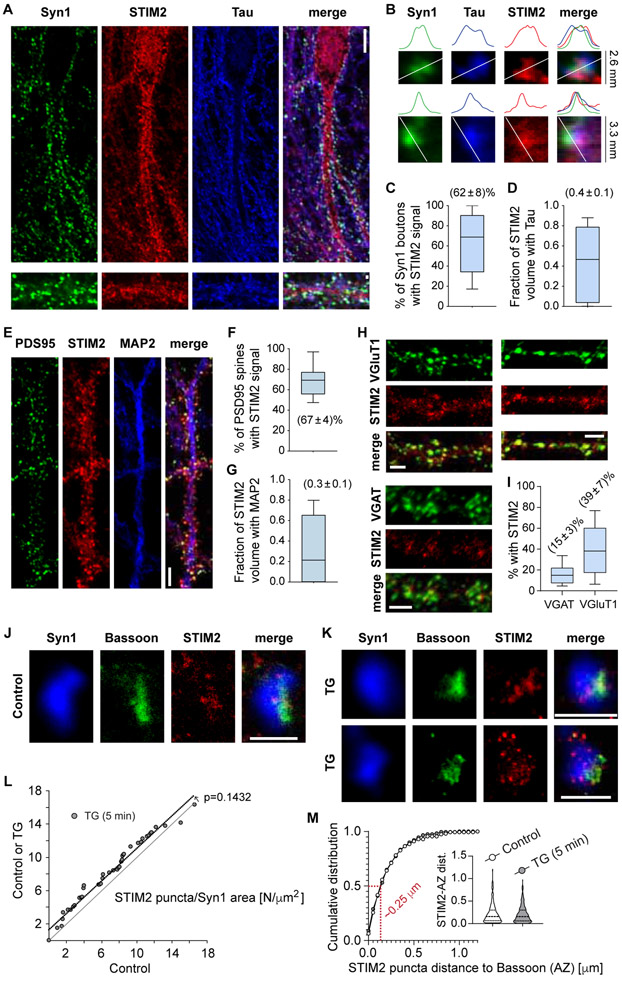
Figure 2. STIM2 is present at hippocampal presynaptic terminals.
A. Representative confocal images showing immunofluorescence staining of the presynaptic marker synapsin-1 (Syn1, green), the axonal marker Tau (blue) and STIM2 (red). White calibration bar for images in the right = 10 μm. White calibration bars for zoomed-in images of synapses on the left = 1 μm.
B. Detailed view of two example presynaptic boutons (top images) and line scans of intensity for each color (bottom). Observe the high degree of spatial co-localization of STIM2 with presynaptic markers.
C. 3D object-based co-localization analysis of syn1 positive boutons with STIM2 (count of number of syn1 objects containing STIM2 signal, expressed as percentage).
D. 3D volume analysis of STIM2 signal and the level of colocalization with Tau (to show the proportion of total neuronal STIM2 localized to axons).
For C and D: data obtained from 2 independent cultures, 2 coverslips, 13 images.
E. Representative confocal images showing immunofluorescence staining of the postsynaptic marker PSD95 (green), the dendrite marker MAP2 (blue) and STIM2 (red). White calibration bars = 5 μm.
F. 3D object-based co-localization analysis of PSD95 positive boutons with STIM2 (count of number of PSD95 objects containing STIM2 signal, expressed as percentage).
G. 3D volume analysis of STIM2 signal and the level of colocalization with MAP2 (to show the proportion of total neuronal STIM2 localized to dendrites).
For F and G: data obtained from 2 independent cultures, 2 coverslips, 13 images.
H. Representative confocal images showing immunofluorescence staining of STIM2 (red) and the glutamatergic or GABAergic markers VGluT1 (top, green) or VGAT (bootom, green), respectively. White calibration bars = 3 μm.
I. 3D object-based co-localization analysis of VGluT1 or VGAT positive boutons with STIM2 (count of number of VGluT1/VGAT objects containing STIM2 signal, expressed as percentage). Data from 2 coverslips, 14 images per group
J-K. 2-D STED images of individual synapses in control (unstimulated) and TG treated (1 μM, 5 min) conditions. Blue: synapsin-1 (confocal); green: Bassoon (STED); red: STIM2 (STED). White calibration bars = 1 μm.
L. Rank plot of number of STIM2 puncta per Syn1 area [N/μm2 ] in control or TG versus control. P-value of the shift was obtained using ROC logistic analysis (3 coverslips per group, 2 cultures).
M. Cumulative histogram of distance to AZ of STIM2 puncta. Red: distance value at 50%. Inset: Violin plot.

