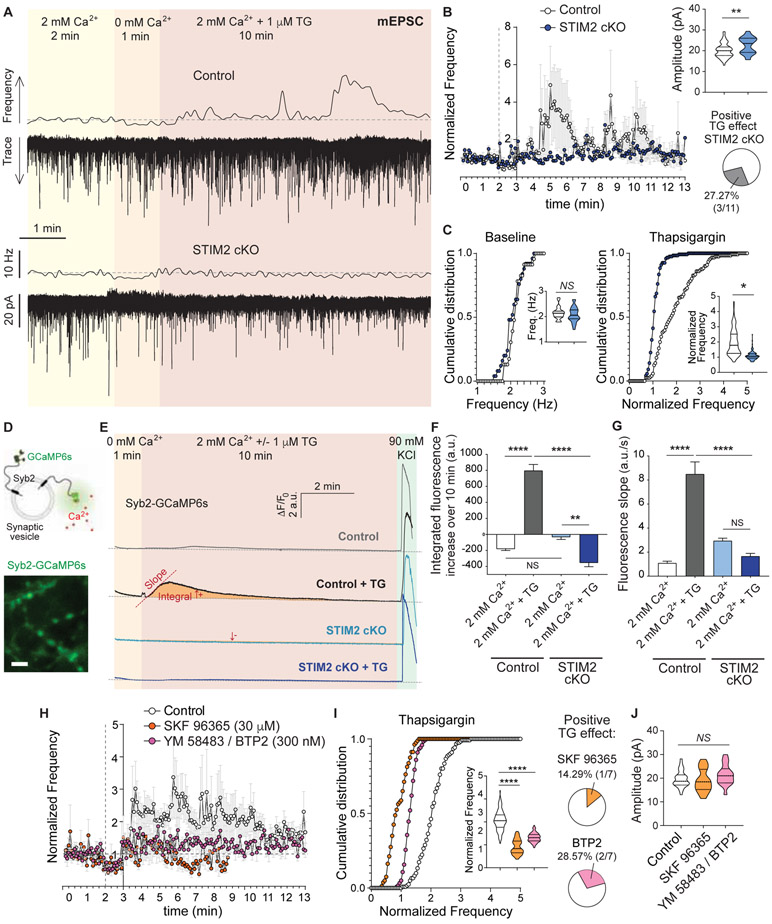
Figure 3. STIM2 and Orai are necessary for the ER Ca2+ depletion-mediated augmentation of excitatory spontaneous neurotransmission.
A. Example traces and 5 s moving averages of frequency of mEPSC recorded from wild type (control) and STIM2 cKO neurons (same experimental design as Figure 1A).
B. Time course of average ± SEM of mEPSC frequency normalized to baseline. Inset (top): Violin plot of mEPSC amplitude. Inset (bottom): Percentage of patched STIM2 cKO neurons showing a positive increase in mEPSC frequency upon TG perfusion.
C. Left: Cumulative histogram and violin plot (inset) of baseline mEPSC frequency. Right: Cumulative histogram and violin plot (inset) of mEPSC frequency during TG perfusion, normalized to baseline
D. Top: schematic representation of the presynaptic Ca2+ sensor syb2-GCaMP6s. Bottom: representative image of syb2-GCaMP6s showing presynaptic boutons stimulated with 90 mM KCl. White calibration bar = 5 μm.
E. Average syb2-GCaMP6s fluorescence traces for control (top, black-grey) and STIM2 cKO (bottom, blue) neurons. The same region was monitored for 1 min in extracellular solution containing 0 mM Ca2+ and then 2 mM Ca2+ with or without 1 μM TG was perfused. 90 mM KCl was perfused at the end of each experiment as a positive control.
F. Total area (integrated fluorescence) of the Ca2+ signal measured after perfusion of 2 mM Ca2+ with or without TG for each experimental group.
G. Initial rate of fluorescence increase (slope) after perfusion of 2 mM Ca2+ with or without TG for each experimental group.
H. Time course of average ± SEM of mEPSC frequency normalized to baseline in control neurons and treated with SKF 96365 (orange circles; 30 μM) or BTP2/YM 58483 (purple circles; 300 nM).
I. Left: Cumulative histogram and violin plot (inset) of mEPSC frequency during TG perfusion, normalized to baseline. Right: Percentage of patched neurons pretreated with the SOCE blockers that showed a positive increase in mEPSC frequency upon TG perfusion.
J. Violin plot of mEPSC amplitude.

