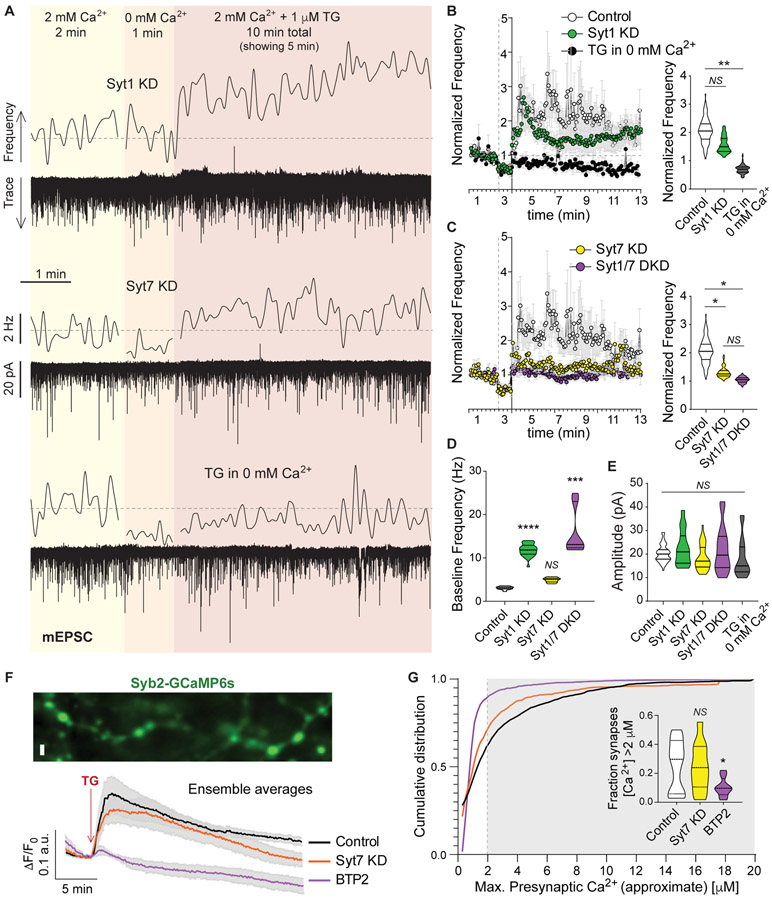
Figure 4. The Ca2+ sensor synaptotagmin-7 mediates the SOCE-dependent augmentation of spontaneous excitatory neurotransmission.
A. Example traces and 5 s moving averages of frequency of mEPSC recorded from syt1 KD (top) and syt7 KD (middle) neurons following the experimental design shown in Figure 1A. Using wild type (control) neurons, another set of experiments were performed perfusing TG in the absence (0 mM) of extracellular Ca2+ (bottom trace and average frequency).
B-C. Left: Time courses of average ± SEM mEPSC frequency normalized to baseline for control, syt1 KD, syt7 KD, syt1/7 DKD and TG in 0 mM Ca2+ experimental groups. Right: Violin plots of normalized mEPSC frequency.
D. Violin plot of baseline (2 mM Ca2+) mEPSC frequency.
E. Violin plots of mEPSC amplitude for control, syt1 KD, syt7 KD, syt1/7 DKD and TG in 0 mM Ca2+ experimental groups.
F. Top: Representative image of syb2-GCaMP6s showing presynaptic boutons. White calibration bar = 2 μm. Bottom: Average syb2-GCaMP6s fluorescence traces for control (black line), syt7 KD (orange line) and BTP2 pretreated (purple line) neurons.
G. Cumulative histogram of maximal presynaptic Ca2+ signal reached after TG perfusion (i.e. peak amplitude converted to concentration, see Methods). Inset: Violin plot of Ca2+ concentration for synapses with increases above 2 μM after TG perfusion (corresponding to grey shaded area in histogram).

