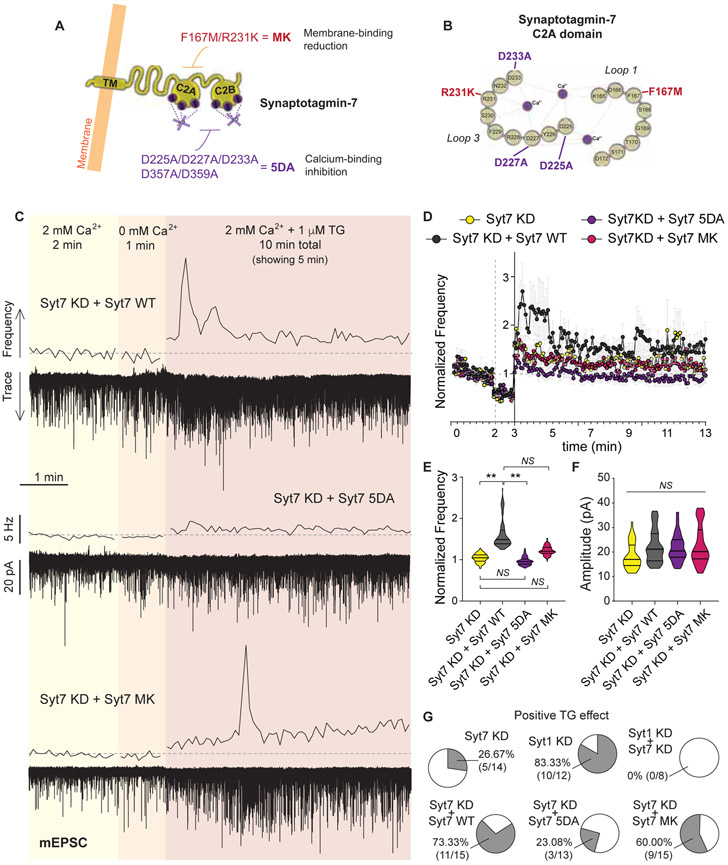
Figure 5. Ca2+ binding to synaptotagmin-7 mediates release of neurotransmitter after SOCE activation.
A. Schematic representation of syt7 structure and domains, showing the mutations performed in this work.
B. Detailed representation of the first Ca2+ binding domain (C2A) of syt7 and the mutation sites.
C. Example traces and 5 s moving averages of frequency of mEPSC recorded from syt7 KD neurons rescued with the full-length wild type (WT) syt7 protein (top), the 5DA mutant for of syt7 (middle) or the MK mutant (bottom); following the same experimental design as in Figure 1A.
D. Time course of average mEPSC frequency normalized to baseline, for syt7 KD and the rescue experiments with syt7 WT, syt7 5DA and syt7 MK.
E. Violin plot of normalized mEPSC frequency during TG perfusion.
F. Violin plot of mEPSC amplitude for syt7 KD neurons and syt7 KD with syt7 WT, syt7 5DA or syt7 MK.
G. Percentage of patched syt7 KD neurons and the rescue groups (WT, 5DA, MK) presenting an increase in mEPSC frequency upon TG perfusion.

