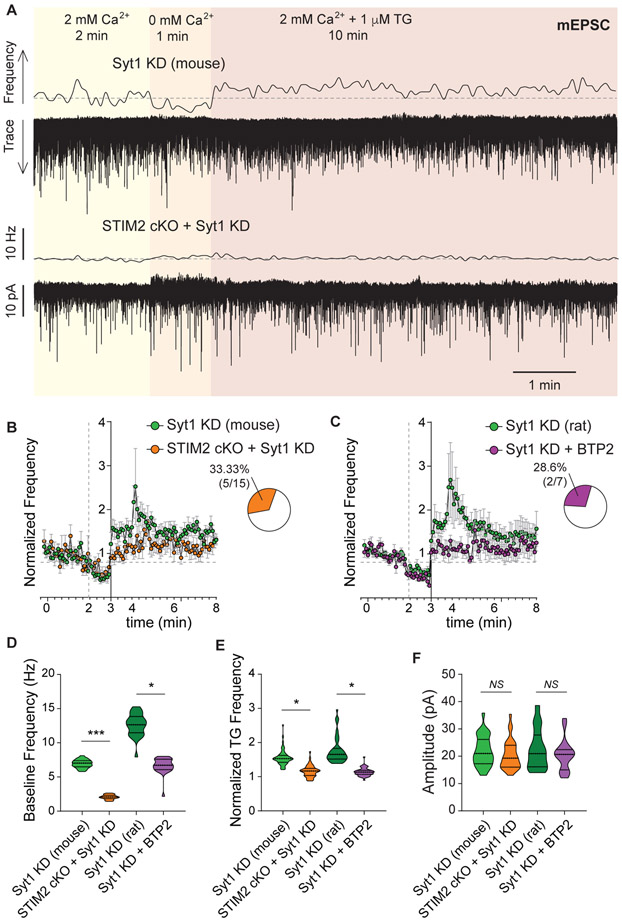
Figure 6. Synaptotagmin-1 clamps SOCE-driven spontaneous release.
A. Example traces and 5 s moving averages of frequency of mEPSC recorded from neurons deficient in syt1 (top) or depleted of both STIM2 and syt1 proteins (bottom; same experimental design as in Figure 1A).
B-C. Time courses of average mEPSC frequency normalized to baseline, for hippocampal dissociated neurons from mice (syt1 KD and syt1 KD + STIM2 cKO) from rats (syt1 KD and syt1 KD + BTP2). Insets: Percentage of patched neurons with a significant increase in mEPSC frequency upon TG perfusion (in syt1 KD plus either STIM2 cKO or BTP2).
D-F. Violin plots of baseline frequency (2 mM Ca2+), normalized frequency during TG perfusion and amplitude of mEPSC for mouse (syt1 KD and syt1 KD + STIM2 cKO) and rat (syt1 KD and syt1 KD + BTP2) hippocampal neurons.

