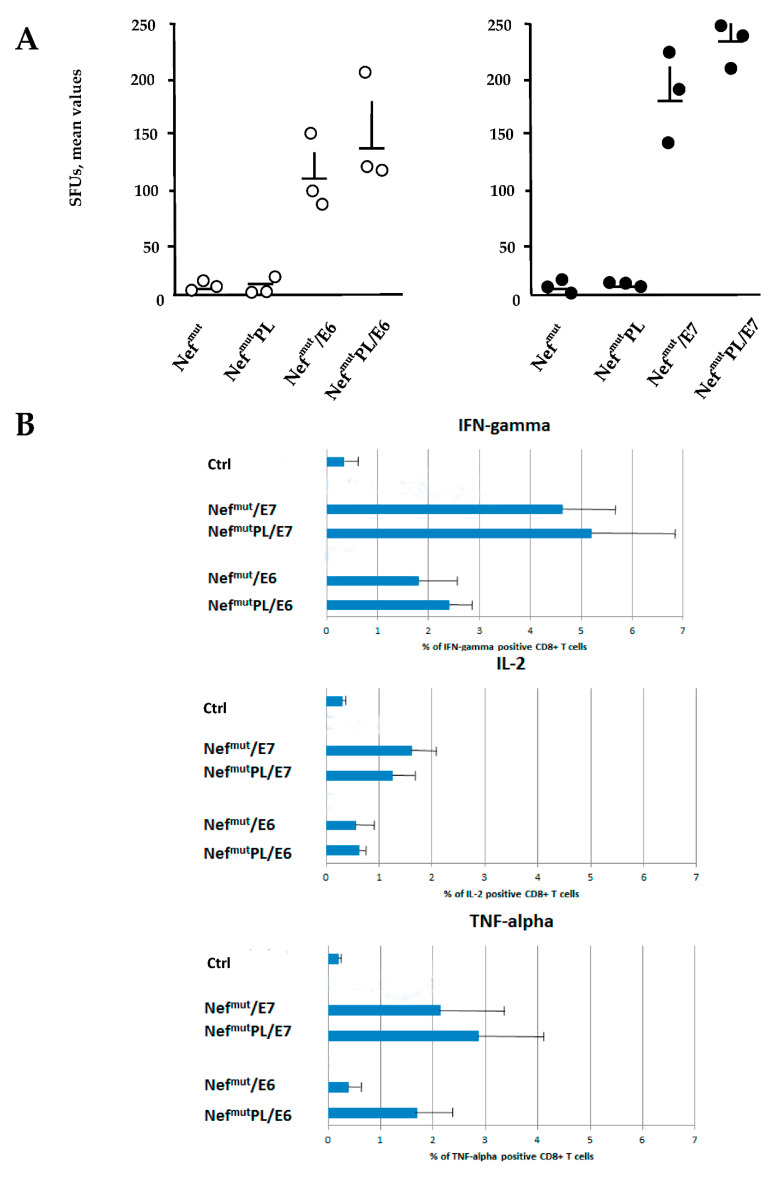
Figure 4.
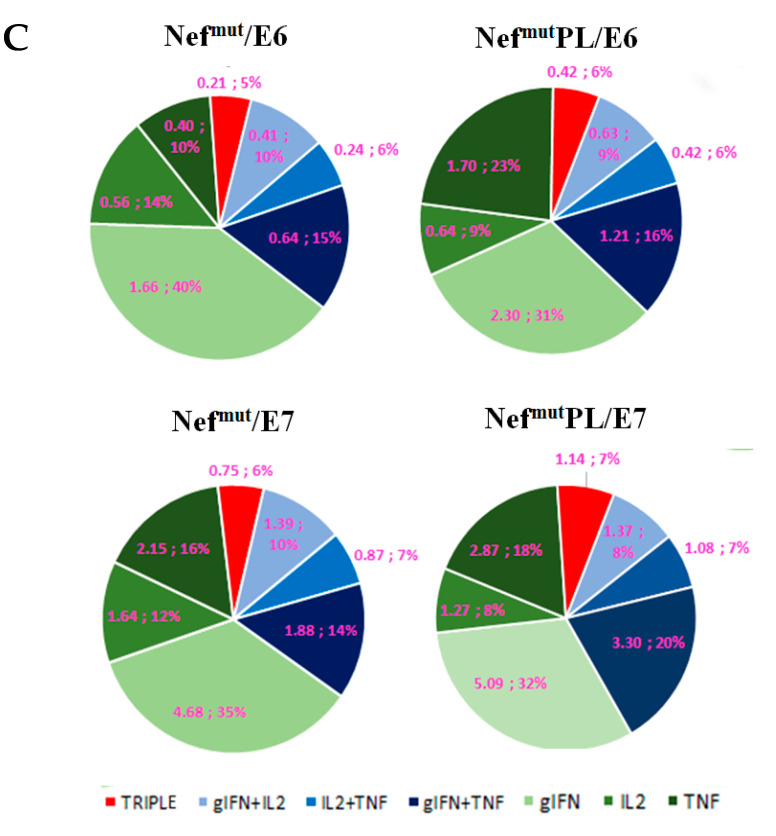
HPV16 E6-and E7-specific CD8+ T cell immunity induced in mice after injection of DNA vectors expressing either Nefmut or NefmutPL. (A). CD8+ T cell immune response in C57 Bl/6 mice inoculated with DNA vectors expressing the indicated fusion products. As a control, mice were inoculated with vectors expressing either Nefmut or NefmutPL. At the time of sacrifice, 2.5 × 10⁵ splenocytes were incubated ON with or without 5 µg/mL of either unrelated (not shown), E6, or E7-specific peptides in triplicate IFN-γ EliSpot microwells. Shown are the number of IFN-γ SFUs/well as mean values of triplicates. Intragroup mean values +SD are also reported. (B). IFN-γ, IL-2, and TNF-α expression in CD8+ T cells from cultures of splenocytes isolated from each mouse injected with the indicated DNA vectors. Splenocytes were incubated ON with or without 5 µg/mL of either unrelated, E6 or E7-specific peptides in the presence of brefeldin A, and then analyzed by ICS. Shown are the mean values +SD of positive CD8+ T cells within total alive CD8+ T cells for each cytokine, as calculated after subtraction of values detected in CD8+ T cells from cultures treated with the unrelated peptide. Ctrl: mean values from cultures of splenocytes isolated from mice injected with Nefmut and NefmutPL expressing vectors. (C). Pie charts indicating the means of both absolute (i.e., over the total of analyzed CD8+ T cells) and relative percentages of CD8+ T cells expressing cytokine combinations within pools of splenocytes from mice injected with the indicated vectors. Percentages were calculated after subtraction of values detected in homologous cultures treated with unrelated peptides. Values detected with splenocytes from mice injected with control vectors were below the sensitivity threshold of the assay (not shown). The results are representative of two independent experiments.


