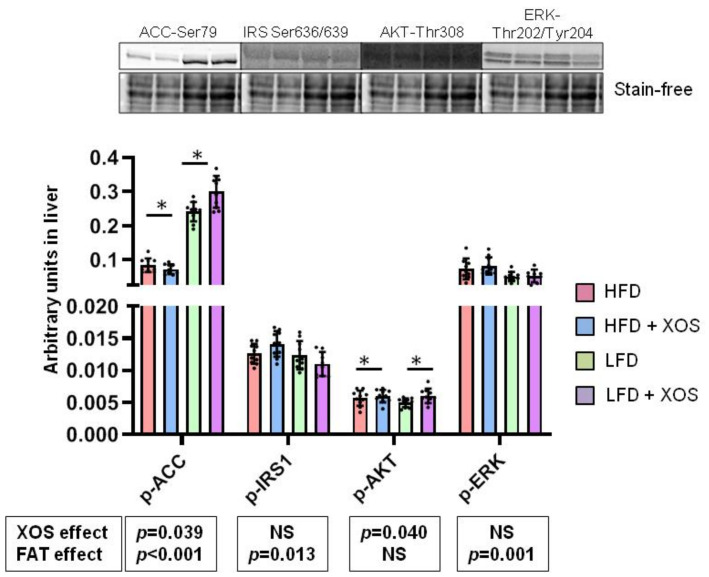
Figure 3.
The phosphorylation levels of ACC, IRS1, AKT and ERK in liver. n = 8–10/group. The graph shows the quantification of the proteins by Western blot. The black dots in the bars show individual data points. Above the graph examples of the blot images are shown. The effects of XOS and dietary fat (FAT) on each phosphorylated protein are indicated in the boxes below the graphs. NS denotes non-significant effect. The effects of XOS were further verified with Mann Whitney U test, and * indicates statistically significant (p < 0.05) difference between the HFD or LFD group and the corresponding XOS-supplemented group as determined by Mann Whitney U test.

