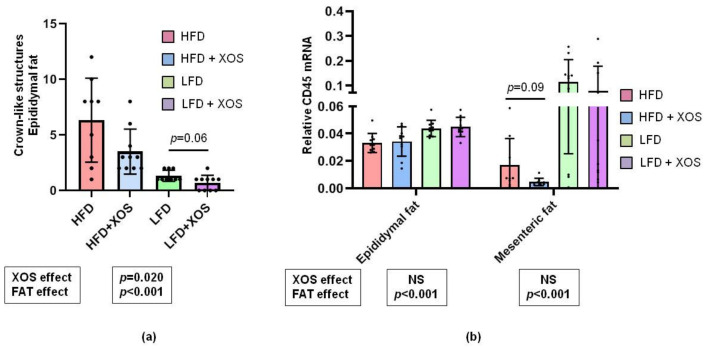
Figure 4.
The effects of the diets on adipose tissue inflammation markers. (a) The graph shows the observed counts of CLSs in epididymal adipose tissue as determined by histopathological scoring. N = 10/group. The black dots in the bars show individual data points. (b) The graph shows the relative expression levels of CD45 mRNA in both epididymal and mesenteric adipose tissue that were quantified with qPCR. n = 8–10/group. The black dots in the bars show individual data points.

