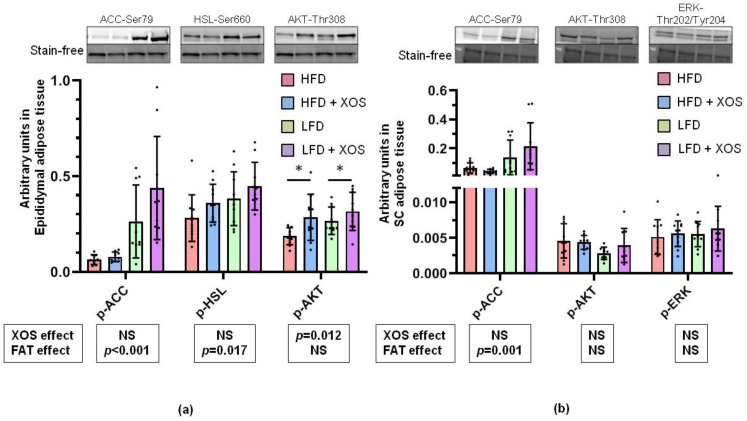
Figure 5.
The effects of the diets on the phosphorylation levels of proteins in the adipose tissues. (a) Phosphorylation levels of ACC, HSL and AKT in epididymal adipose tissue. (b) Phosphorylation levels of ACC, AKT and ERK in subcutaneous (SC) adipose tissue. * indicates statistically significant (p < 0.05) difference between the HFD or LFD group and the corresponding XOS-supplemented group as determined by Mann Whitney U test.

