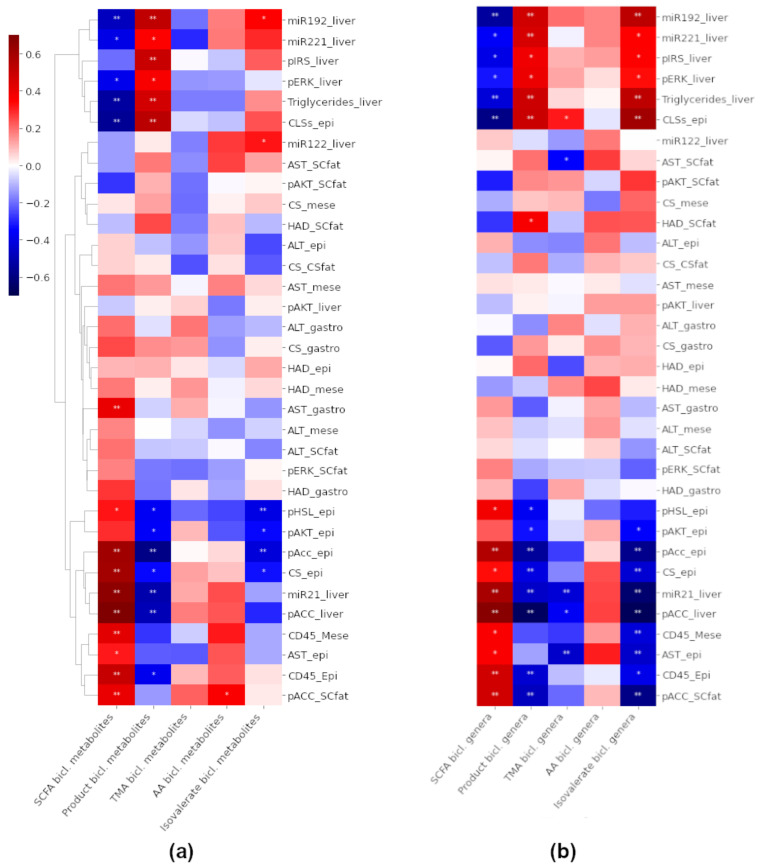
Figure 7.
Heat maps of Spearman correlation coefficients between the total abundances of (a) The metabolites and (b) The genera in each bicluster and different biomarkers. The color of a node indicates the magnitude and the direction of correlation. Hierarchical clustering was applied to biomarkers. The raw metabolite abundances were summed, and the relative genus abundances were summed and then clr-transformed. epi = epididymal fat, mese = mesenteric fat, SCfat = subcutaneous fat, gastro = gastrocnemius muscle. * denotes p < 0.05 and ** p < 0.01.

