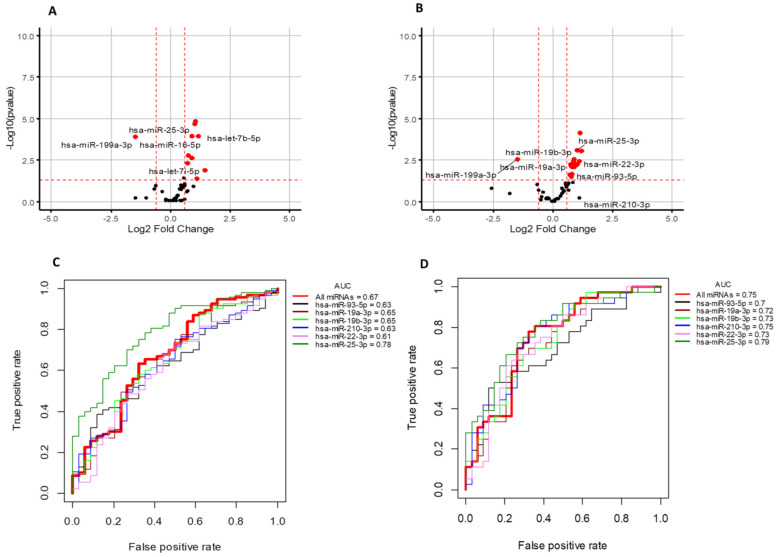
Figure 1.
(A,B) Volcano plots showing the log2 fold difference between samples form healthy controls (n = 34) and breast cancer patients (n = 93) on the x-axis versus a measure of statistical significance (–log10 adjusted p-value) on the y-axis. Each point in the plot refers to a specific miRNA. The miRNAs that satisfied the criteria with adjusted p-value (BH) <0.05 are marked and highlighted as red marks in the figure. The miRNAs depicted in a black color did not have a significant adj-pvalue (BH). (A) Significantly regulated miRNAs in all breast tumors compared to control samples. (B) Significantly regulated miRNAs in TNBC compared to control samples. (C,D) AUC/ROC analysis (area under the curve/receiver operating characteristic curve) of significant differentially regulated miRNAs. (C) All breast cancers vs. control, (D) TNBC vs. control samples. AUC/ROC curves corresponding to individual miRNAs are plotted with different colors. The thick red in each plot represents the cumulative average expression of all miRNAs. See Table S2, Figure S3, and Supplementary Figure S4 for complementary data.

