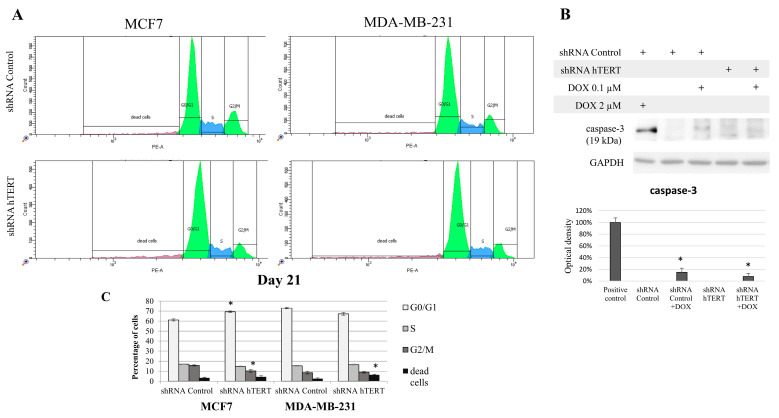
Figure 4.
The contribution of hTERT downregulation to cell cycle modification of breast cancer cells. (A) Propidium iodide labeling and representative flow cytometry histograms of cell cycle analysis. Both studied cell lines, i.e., MCF7 and MDA-MB-231 were subjected to the cell cycle analysis 21 days after transduction. (B) Graphical representation of the histogram results. Data are expressed as the mean ± SD of the data obtained from at least three independent experiments. * p < 0.05. (C) Analysis of caspase-3 involved in I programmed cell death in MDA-MB-231 cells. Immunodetection of cleaved caspase-3 was performed using Western blot on 21st-day post-transduction, after 8 h DOX (0.1 μM) treatment; densitometry analysis was performed out of three scanned membranes from three independent experiments; 2 μM DOX was used as a positive apoptosis control (8 h treatment). (*) p < 0.05 relative to shRNA Control.

