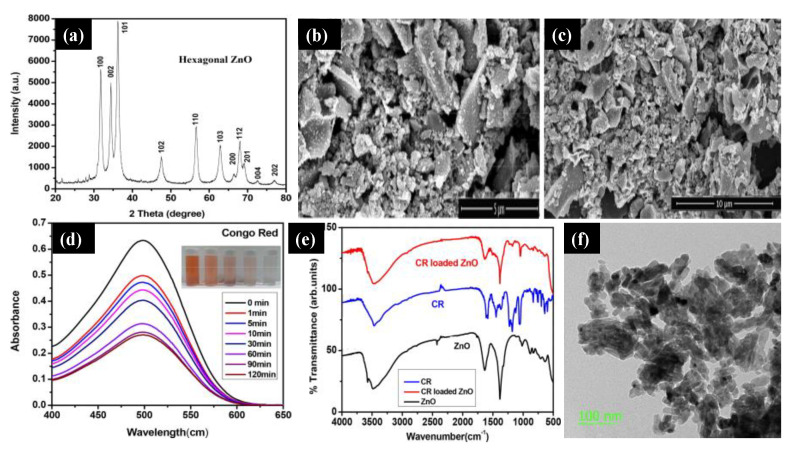
Figure 3.
(a) X-ray diffraction pattern of the ZnO NPs. (b,c) Scanning electron microscopy images of agglomerated ZnO NPs. (d) UV–Vis spectra of the Congo red (CR) dye versus time. (e) The FTIR spectra of the ZnO NPs, CR dye, and CR–loaded ZnO NPs. (f) Transmission electron microscopy of the ZnO NPs at a 100 nm scale. Figure adapted with permission from Reference [39]. Copyright 2020 Elsevier.

