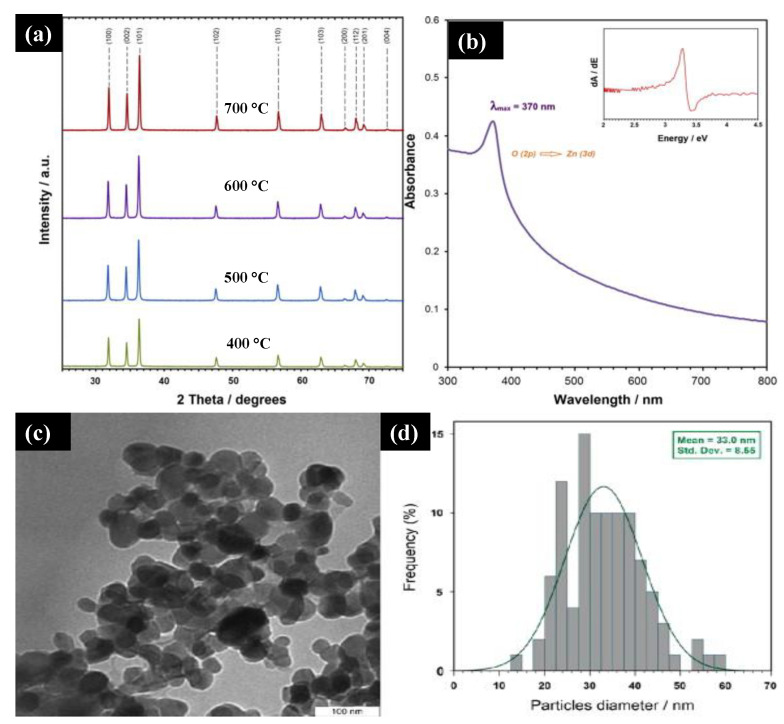
Figure 4.
(a) XRD plot of synthesized ZnO NPs at different calcinations at 600 °C. (b) The UV-Vis spectra of the ZnO NPs synthesized at 600 °C. (c,d) TEM image and particle size distribution of ZnO NPs in gum tragacanth (GT) media synthesized at 600 °C. Figure adapted with permission from Reference [41] Copyright 2013 Elsevier.

