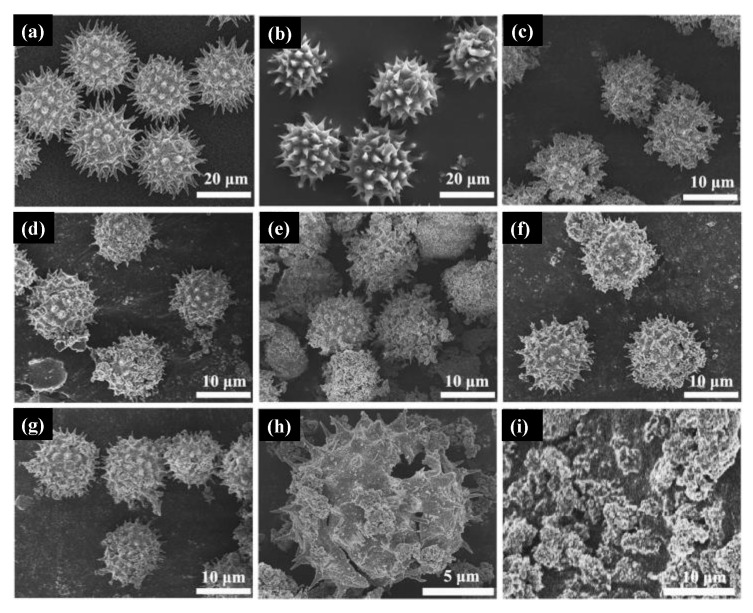
Figure 11.
Micrograph of sunflower pollen (a), ZrO2-doped TiO2 spinous hollow sample before calcination (b), 4.6% doped TiO2 sample (c), 8.8% doped TiO2 sample (d), 12.6% doped TiO2 sample (e), 18.2% doped TiO2 sample (f), calcinated sample presented in a smaller size due to the removal of the pollen template (g), hollow microsphere (h), and TiO2 samples synthesized without templates (i). Figure adapted with permission from [167] Copyright 2018 Elsevier.

