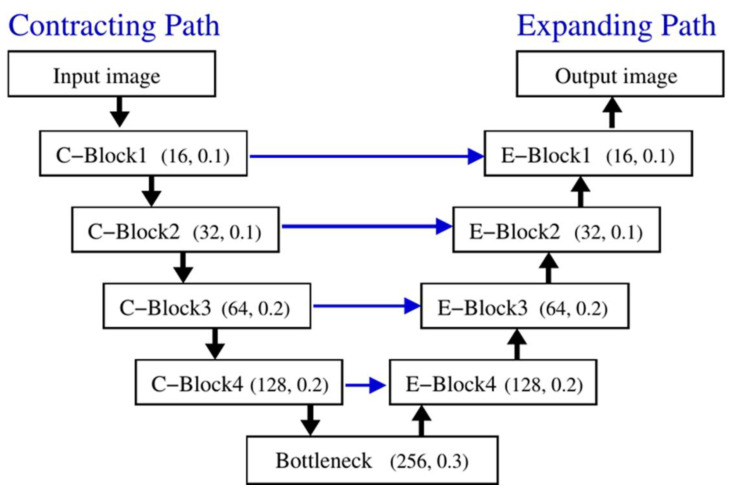
Figure 4.
Structure of U-Net model. In each block, number of filters and dropout rate used in convolution and up-sampling layers are labeled . Black arrows indicate direction of processing. Blue arrows indicate that extracted image feature maps of C-blocks are concatenated with corresponding E-blocks to enhance learning performance and maintain reconstructed image quality in expanding path. Refer to Table 1 for detailed structure of each block.

