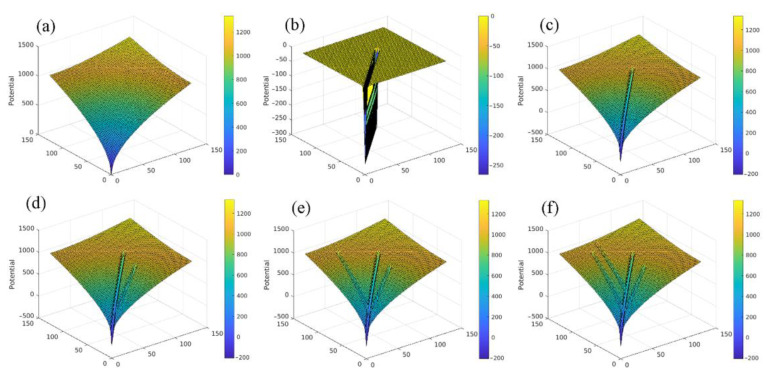
Figure 5.
Illustration of development of potential field with respect to pathway network formation. (a) Root potential evaluated from Equation (1) based on root point located at (0,0). (b) Potential contributed by first pathway of Equation (2), forming a valley shape along the pathway. (c) Total potential, which is the sum of root potential (a) and first pathway potential (b). (d–f) Adding more pathways formed by other end points successively leads to the development of potentials contributed by these pathways one by one, which consecutively modify the total potential field.

