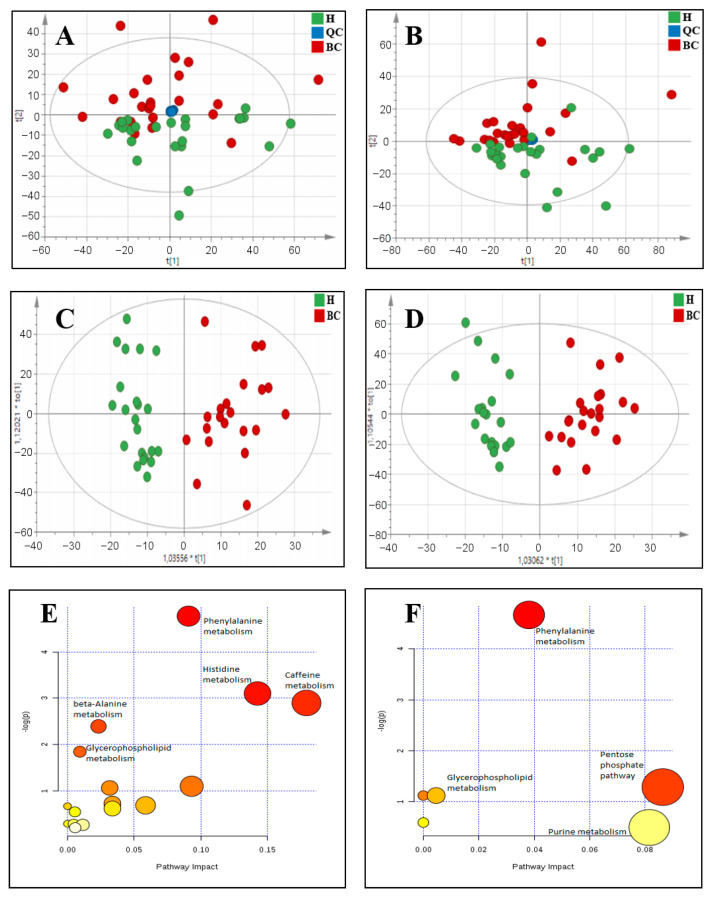
Figure 1.
Observed differences in metabolic profiles of control and BC patients: (A) PCA score plot for positive ionization mode, with PC1 describing 12.8% of the variation and PC2 describing 5.5%, (B) PCA plot for negative ionization mode, with PC1 describing 13.6% of the variation and PC2 describing 5.5%, (C) Score plot of OPLS-DA model for positive ionization mode, with R2 = 85.2% and Q2 = 46%, (D) Score plot of OPLS-DA model for negative ionization mode, with R2 = 88.2% and Q2 = 43.3%, (E) Pathway analysis of differential metabolites in positive ionization mode, (F) Pathway analysis of differential metabolites in negative ionization mode.

