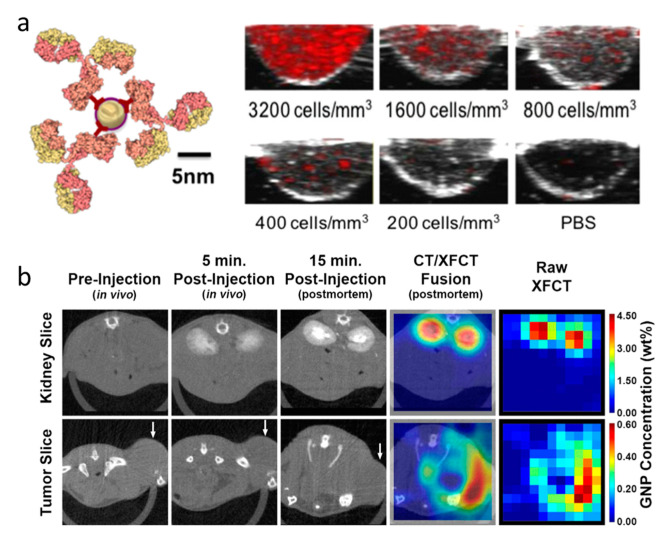
Figure 4.
(a) Schematic of the epidermal growth factor receptor I (EGFR)-targeted AuNPs and representative Photoacoustic imaging (PAI) cross-sectional images of AuNPs labelled A431 cells at different concentrations. Adapted with permission from [70], copyright 2019 Optical Society of America. (b) Time course reconstructed axial CT images after AuNPs injection and X-ray fluorescence computed tomography (XFCT) images at the levels of the kidneys and tumor (white arrow). Adapted with permission from [71], published by Springer Nature.

