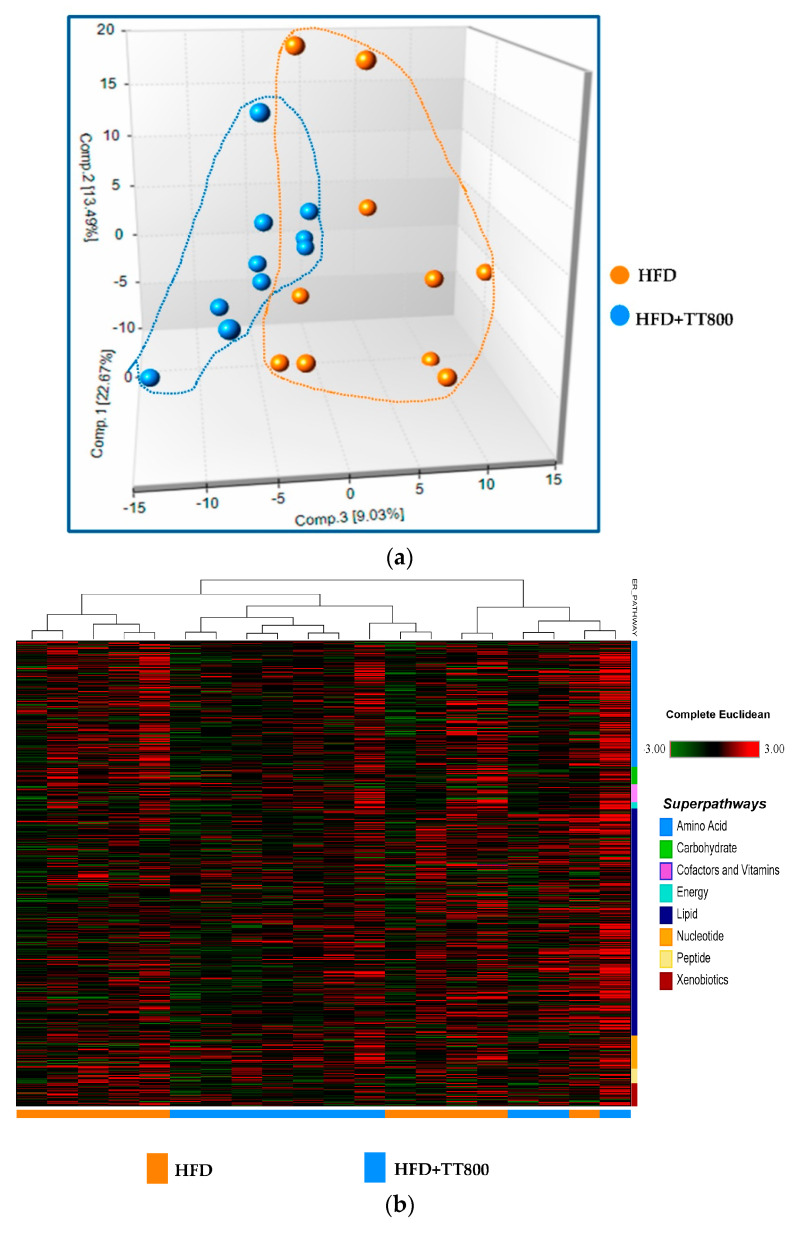
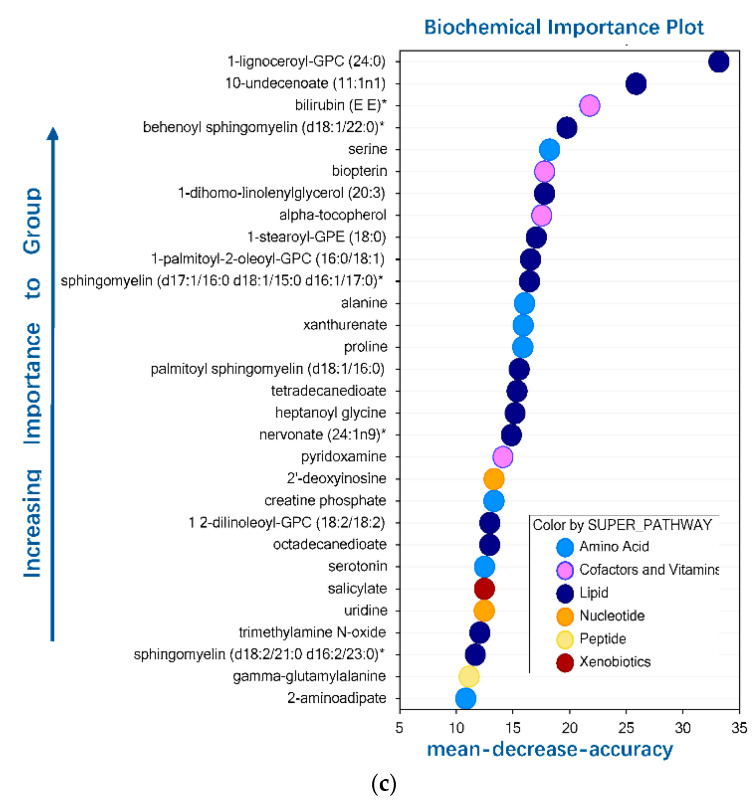
Figure 1.
(a) Principal component analysis (PCA) showed differences in metabolites of serum samples in mice between the control HFD group and the treatment HFD+TT800 group. Each ball represents the cumulative metabolites from each mouse. The 10 orange balls are mice from the control HFD group and 10 blue balls are mice from the HFD+TT800 group. Metabolites associated with mice in the TT800 group are more tightly associated or closer together than those from mice in the control HFD group. TT supplementation appears to narrow the range of metabolite data in the mice fed the HFD. Each dietary group was comprised of n = 10 mice. (b) Differences in eight superpathways of serum metabolites between the control HFD group and the HFD+TT800 group. Heatmap of the hierarchical cluster analysis of serum metabolites by Student’s t-test to distinguish the eight superpathways of metabolites between the control HFD group and the HFD+TT800 group. The eight superpathways include amino acids, carbohydrates, cofactors and vitamins, energy metabolites, lipids, nucleotides, peptides, and xenobiotics. Color in red indicates up-regulation and color in green indicates down-regulation (fold changes, p < 0.05). Each dietary group was comprised of n = 10 mice. (c) Biochemical importance plot based on random forest classification of the overall metabolomics profile for mouse serum samples. Random forest analysis distinguishes between the control HFD group subsets of superpathways and the treated HFD+TT800 group subsets of superpathways. Progression to TT800 supplementation was set as the response variable and all serum metabolites or biochemicals identified by the platform were set as predictors. The biochemicals are plotted according to the increasing importance to group separation to elucidate the metabolic fingerprint for TT800 supplementation as compared to the control HFD group. The figure presents the 30 top-ranked metabolites and their classification (indicated in the figure, lower right) based on their importance for the identification of the two treatment subsets. Light blue = amino acid, pink = cofactors and vitamins, dark blue = lipid, orange = nucleotide, light yellow = peptide, burgundy = xenobiotics. Each dietary group was comprised of n = 10 mice.


