Figure 1.
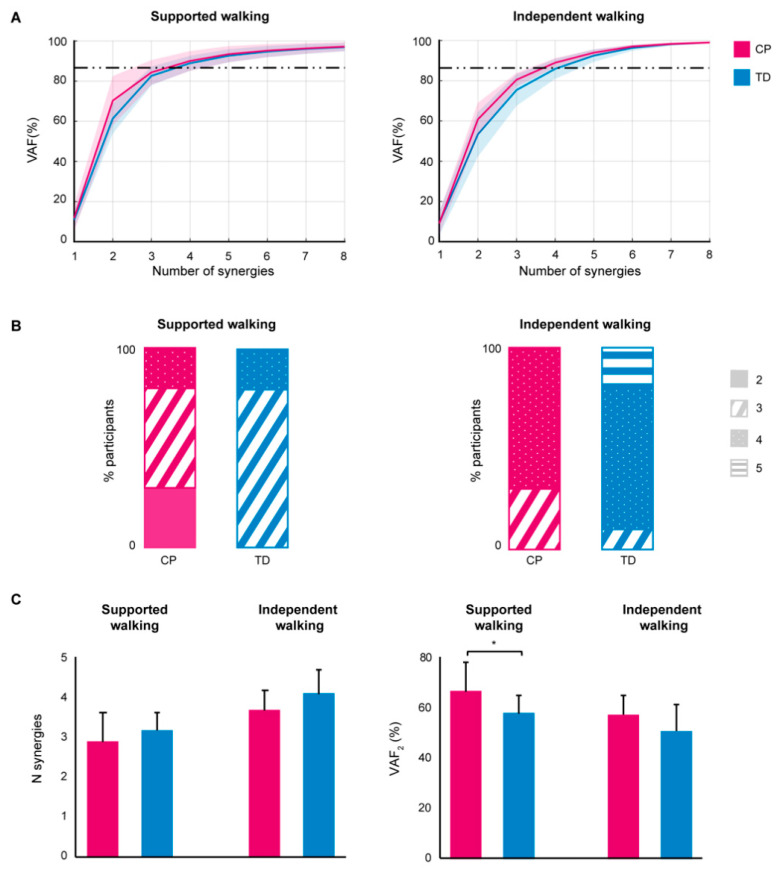
Bilateral EMG analysis results. (A) Mean variability accounted for (VAF) ± SD, per synergy 1–8 for the cerebral palsy (CP) and typically developing (TD) group, for supported walking (left) and independent walking (right); (B) Percentage number of synergies per group (n = 10) based on a VAF threshold of 85% or added VAF < 8% for the CP and TD group, for supported (left) and independent walking (right); (C) Mean number (N) of synergies (left) and variability accounted for (right) by two synergies (VAF2) for the CP and TD group, for supported walking and independent walking. Error bars indicate SDs, * p < 0.05.

