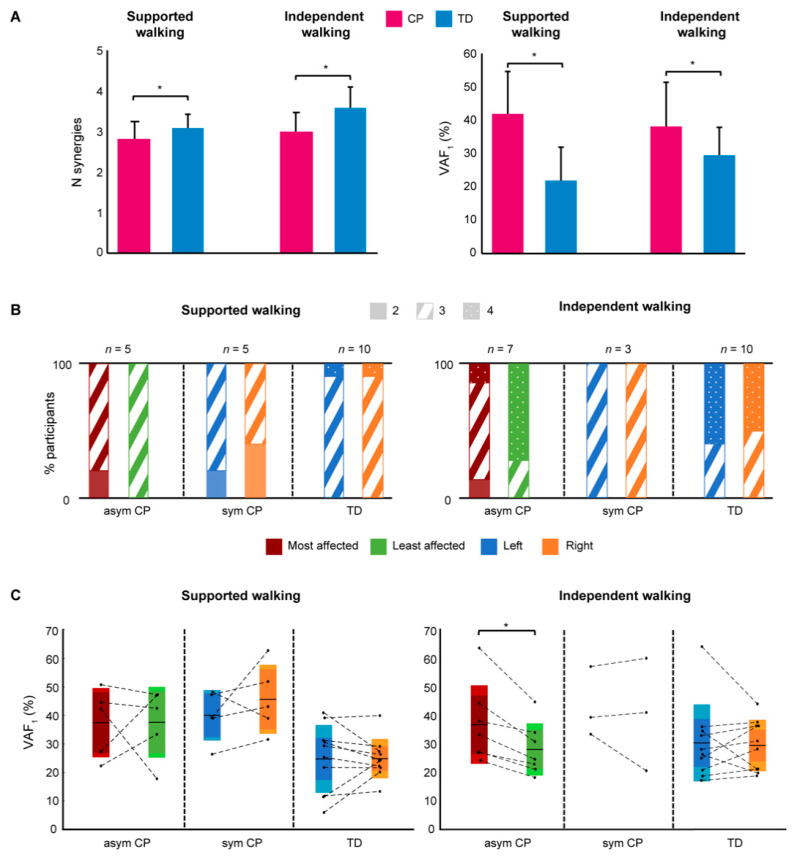
Figure 3.
Unilateral EMG analysis results. (A) Mean number (N) of synergies (left) and variability accounted for (right) by one synergy (VAF1) for the CP and TD group, for supported walking and independent walking. Error bars indicate SDs. The unilateral EMG analysis involves the most affected side for the asymmetric CP group and a random side for the symmetric CP and TD group. (B) Percentage number of synergies for each side. The most affected (red) and least affected (green) side for asymmetric CP, and the left (blue) and right (orange) side for symmetric CP and TD. (C) Variability accounted for by one synergy (VAF1) for each side. Mean VAF1 per side is indicated by the black line in the middle of the box. The dark color of the box indicates the 95% confidence interval, and the lighter color one standard deviation. Individual participant values are indicated by black dots, and both sides of each participant are connected by broken lines. Significance between sides is indicated by a *, p < 0.05. Abbreviations: asym = asymmetric; sym = symmetric; n = number of participants.

