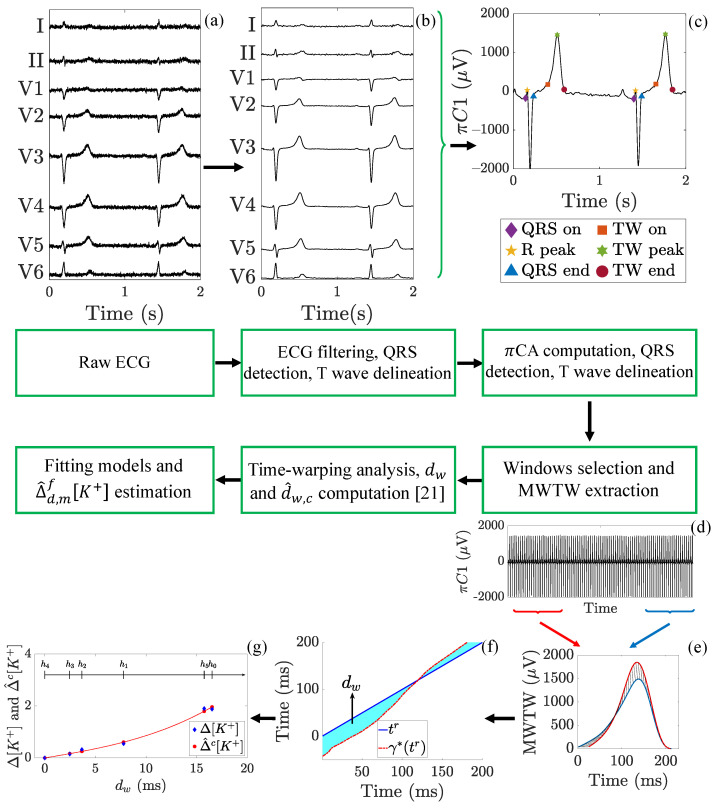
Figure 3.
Flow chart showing the ECG processing steps performed in this study. (a) Raw ECG (the eight independent leads I, II, V1 to V6 are shown) obtained from one of the enrolled ESRD-HD patients (see Section 2). (b) Preprocessed ECG as described in Section 3.1. (c) CA is applied and both QRS complexes and T-waves (TW in the legend) are detected and delineated as detailed in Section 3.2. (d) From 2-min wide windows, (e) a mean warped T-wave (MWTW) is extracted and (f) T-wave morphology markers and are computed as stated in Section 3.3. (g) The fitting models for estimation are evaluated as in Section 3.5. In this example, a cubic model with m = a is presented.

