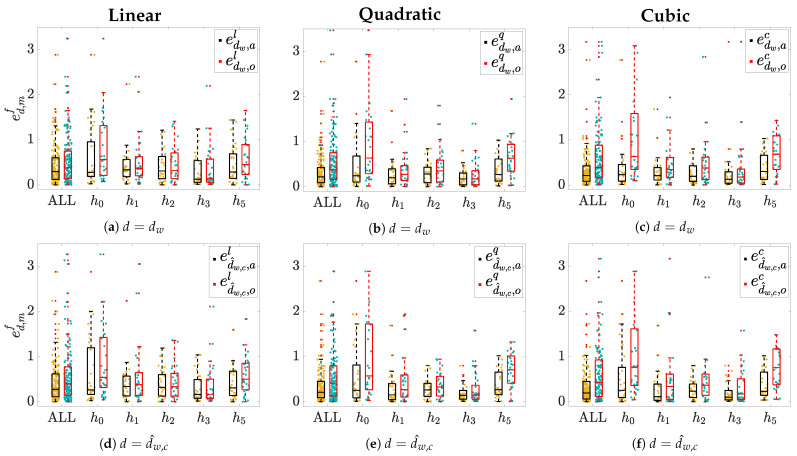
Figure 4.
Estimation error () distributions across patients for each hour hi and when pooling all samples together (ALL). Panels (a,d) show results for linear models f = l; panels (b,e) show the quadratic and panels f = q; and (c,f) show the cubic model f = c. Yellow dots represent individual error values when m = a, while light-blue ones denote those obtained when m = o. Corresponding boxplots are depicted on top of each distribution: The black ones represent the errors in m = a while the red ones represents error in case of m = o. “+” denotes outliers.

