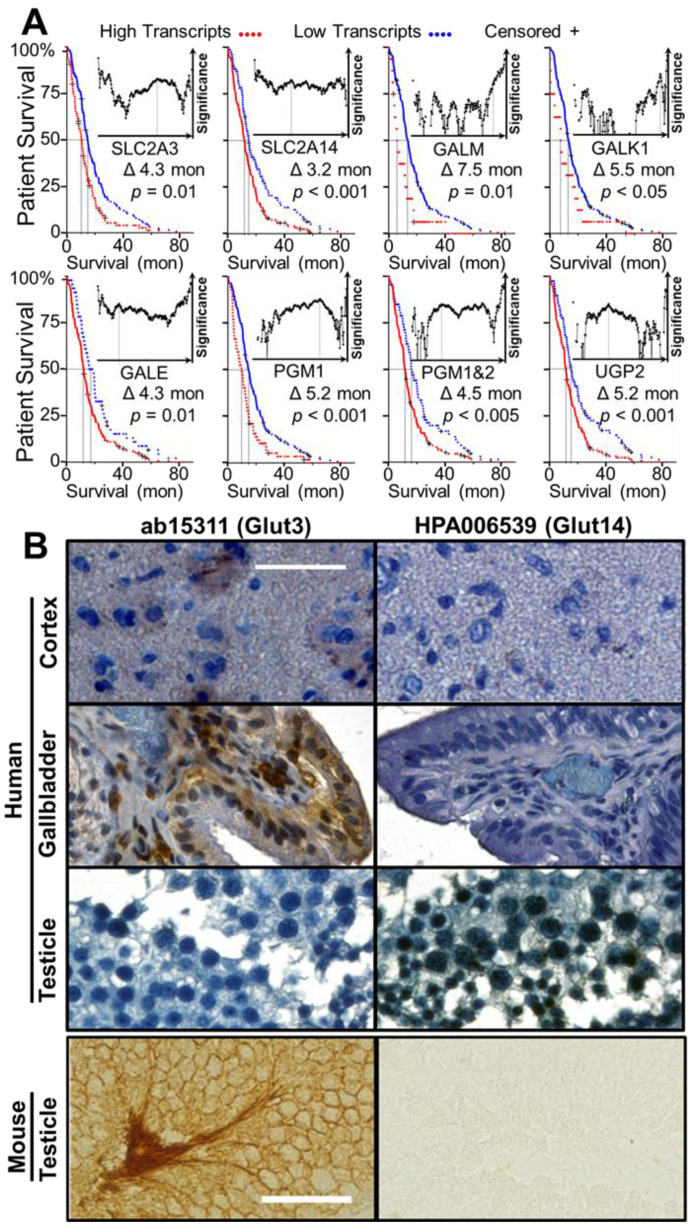
Figure 2.
Correlation between the expression levels of Gal import genes (SLC2A3, SLC2A14, GALM, GALK1, GALE, PGM1/2 and UGP2) and the patient survival. Also shown are the expression of Glut3 and Glut14 in human/mouse tissues. (A) Kaplan–Meier survival curves of the genes associated with Gal import and metabolism using the TCGA RNA-Seq database: red, high expression; blue, low expression; +, censored. (B) ab15311 (anti-Glut3) and HPA006539 (anti-Glut14) and antibody target validation in human and mouse tissues, visualized using DAB staining. Scale bar = 50 µm.

