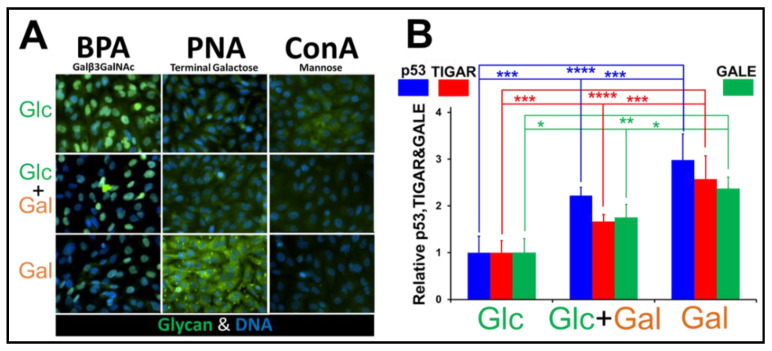
Figure 6.
Glycan labeling and levels of p53/TIGA/GALE in Glc, Glc&Gal, and Gal treated GBM cells. (A) The labeling of glycans in GBM115 cells grown on Glc, Glc and Gal, or Gal (48 h). The glycans were labeled with FITC-lectins (green) and their nuclei were labeled with DAPI (blue). (B) Graph showing the levels of p53, TIGAR, and GALE as a function of increased Gal in GBM cells treated with Glc, Glc and Gal, or Gal alone (mean ± SEM; * p < 0.05, ** p < 0.001, *** p < 0.005 and **** p < 0.0001. n = 8 (p53 and TIGAR) and n = 4 (GALE). Measured by immunofluorescence microscopy.

