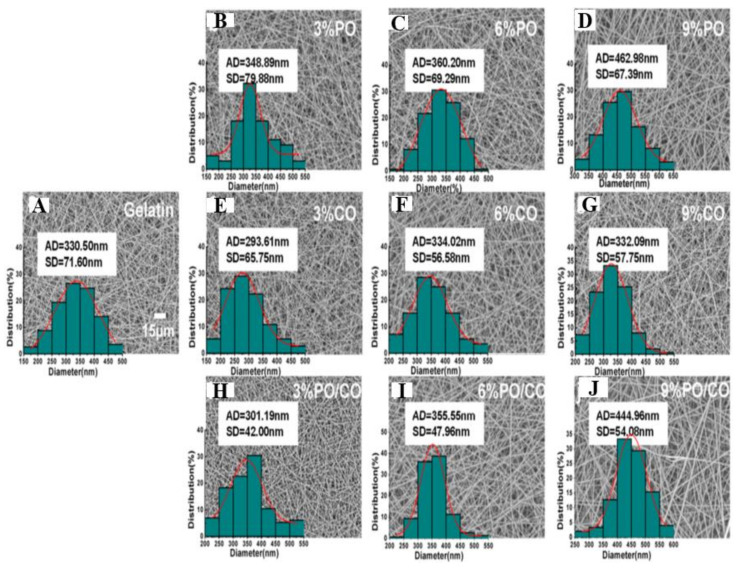
Figure 12.
GEL/essential oil nanofiber diameter distribution and scanning electron microscope photos. (A) GEL nanofibers; (B–D) GEL/PO nanofibers with PO ratios of 3%, 6%, and 9%; (E–G) GEL/CO nanofibers with CO ratios of 3%, 6%, and 9%; (H–J) GEL/PO/CO nanofibers with PO/CO ratios of 3%, 6%, and 9% (v/v), respectively. Standard deviation and average diameter are referred to as SD and AD, respectively. Reproduced from [262] with the copyright permission from American Chemical Society.

