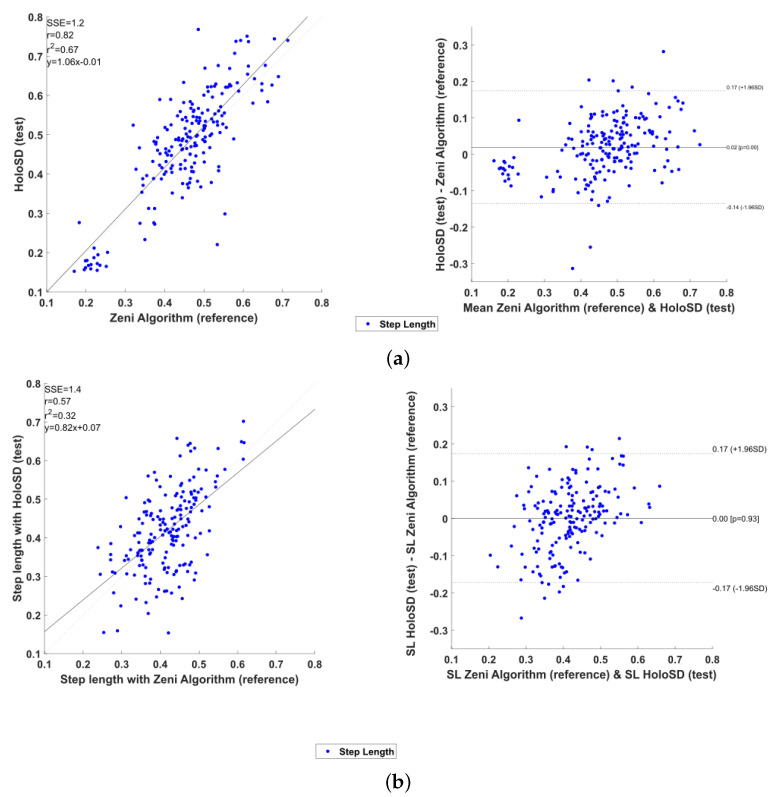
Figure 6.
Statistical analysis graphics for children with CP. Left: Linear Distribution of step length between the two algorithms. Right: Bland and Altman plot representing step length. A bolt horizontal line representing the bias. Additional dotted horizontal lines, limits of agreement, are added to the plot at SD. (a) Children with CP—Group 1 (b) Children with CP—Group 2.

