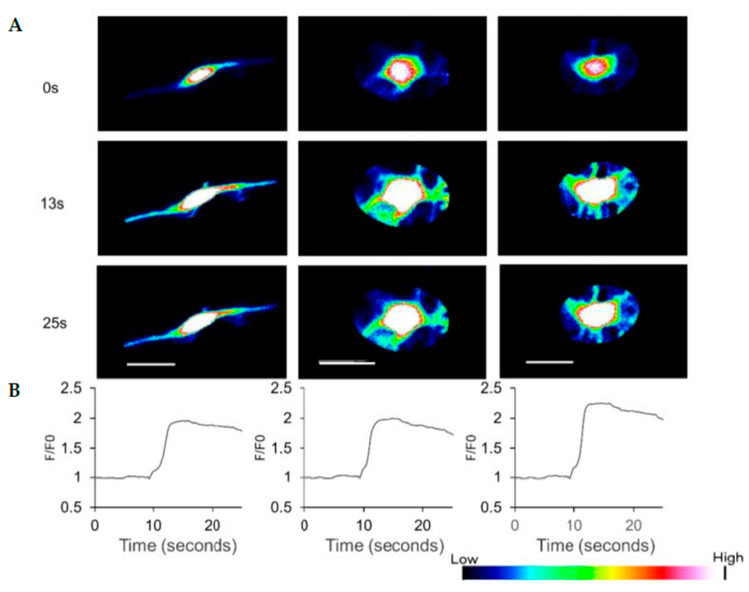
Figure 4.
Effect of ATP on Ca2+ levels in dopaminergic neurons differentiated from HAP stem cells. (A) ATP caused Ca2+ concentration changes in the dopaminergic neurons with time observed. (B) The line-plots in the bottom panels show the relative fluorescence ratio (F/F0), where F0 is fluorescence before treatment with ATP, and F is fluorescence after treatment. Scale bar = 20 μm.

